Plot observations as dots.
Usage
dotPlot(
  x,
  fact = NULL,
  vertical = FALSE,
  at = 1,
  key = NULL,
  pch = 20,
  col = fadeColor("black", "66"),
  cex = 1.5,
  add = FALSE,
  axes = TRUE,
  xlim = NULL,
  ylim = NULL,
  ...
)
Arguments
- x
A numerical vector.
- fact
A character or factor vector defining the grouping for data in
x.- vertical
If
TRUE, the plot will be oriented vertically.- at
The vertical coordinate of the points, or the horizontal coordinate if
vertical=TRUE. Iffactis provided, then locations can be specified for each group.- key
The factor levels corresponding to
at,pch,col, andcex.- pch
Plotting character. If
factis given, then different plotting characters can be specified for each factor level. Ifkeyis specified, the elements ofpchwill correspond to the elements ofkey.- col
Plotting character color. If
factis given, then different colors can be specified for each factor level. Ifkeyis specified, the elements ofcolwill correspond to the elements ofkey.- cex
Plotting character size. If
factis given, then different character sizes can be specified for each factor level. Ifkeyis specified, the elements ofcexwill correspond to the elements ofkey.- add
If
TRUE, then the points are added to the plot.- axes
If
FALSE, no axes are plotted.- xlim
Limits for the x axis.
- ylim
Limits for the y axis.
- ...
Additional arguments to be passed to
plotifadd=FALSEorpointsifadd=TRUE.
Examples
library(dplyr)

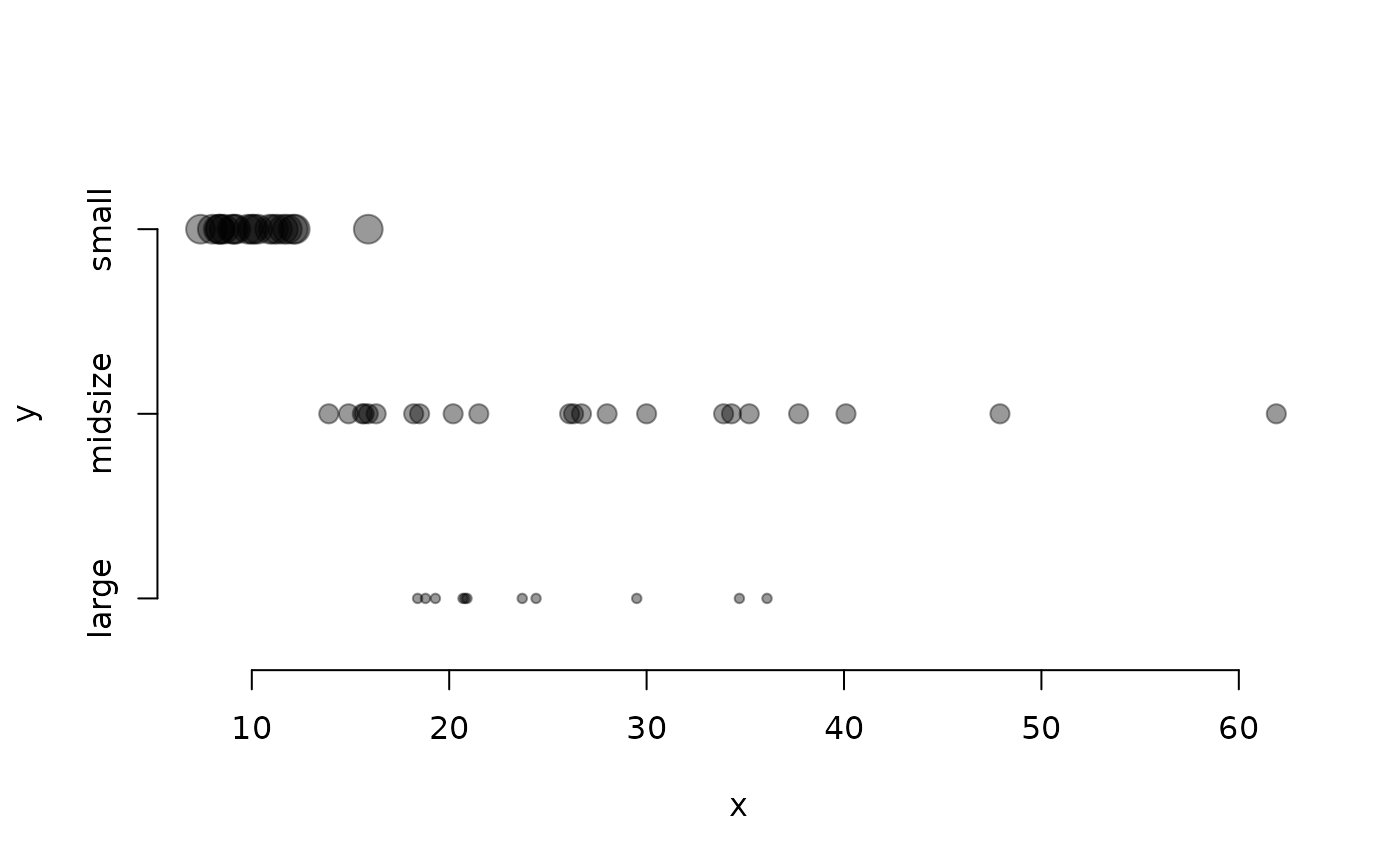
# Price by type
dotPlot(cars93$price,
  cars93$type,
  key = c("large", "midsize", "small"),
  cex = 1:3
)


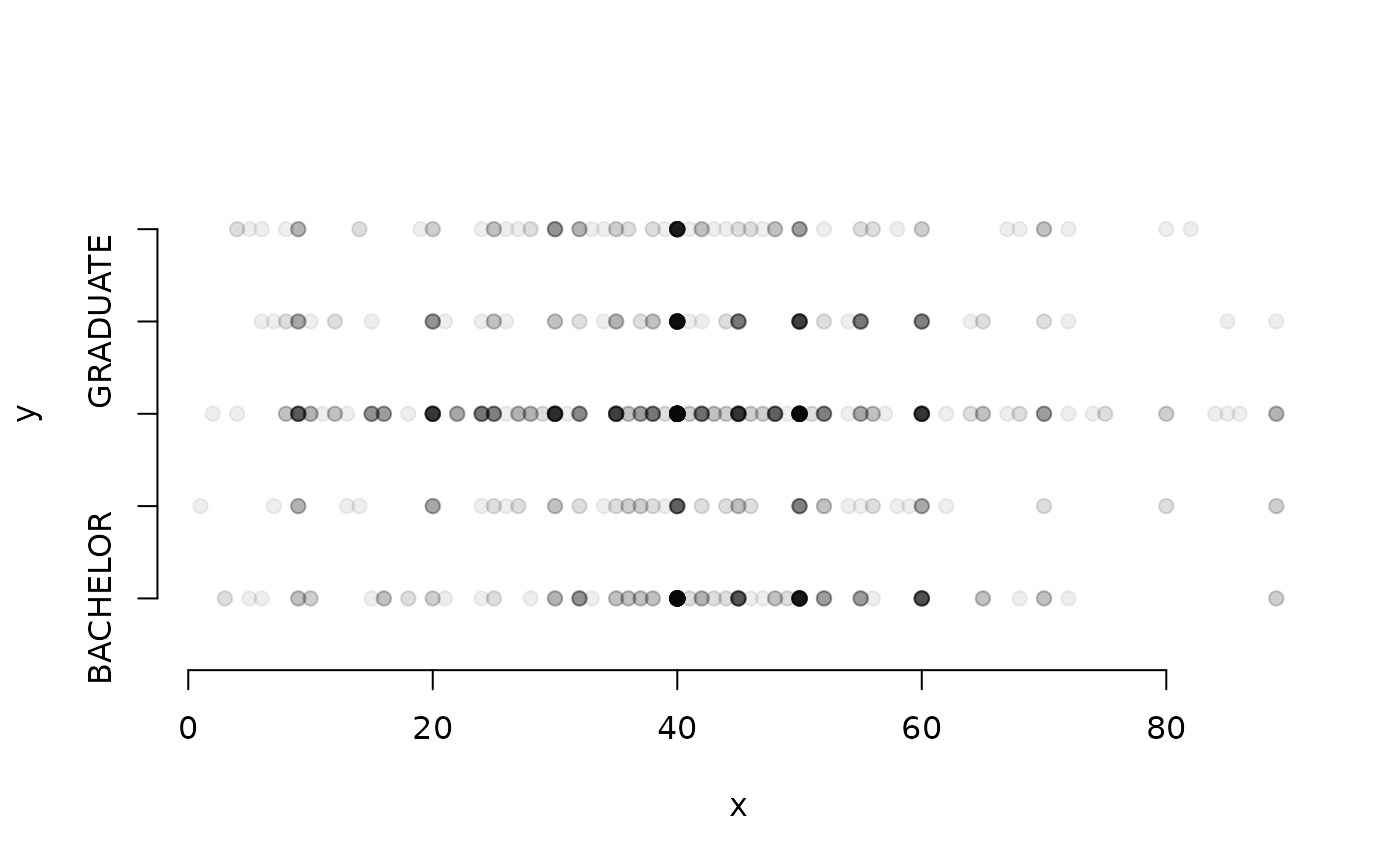
# Hours worked by educational attainment or degree
gss2010_nona <- gss2010 |>
  filter(!is.na(hrs1) & !is.na(degree))

dotPlot(gss2010_nona$hrs1,
  gss2010_nona$degree,
  col = fadeColor("black", "11")
)


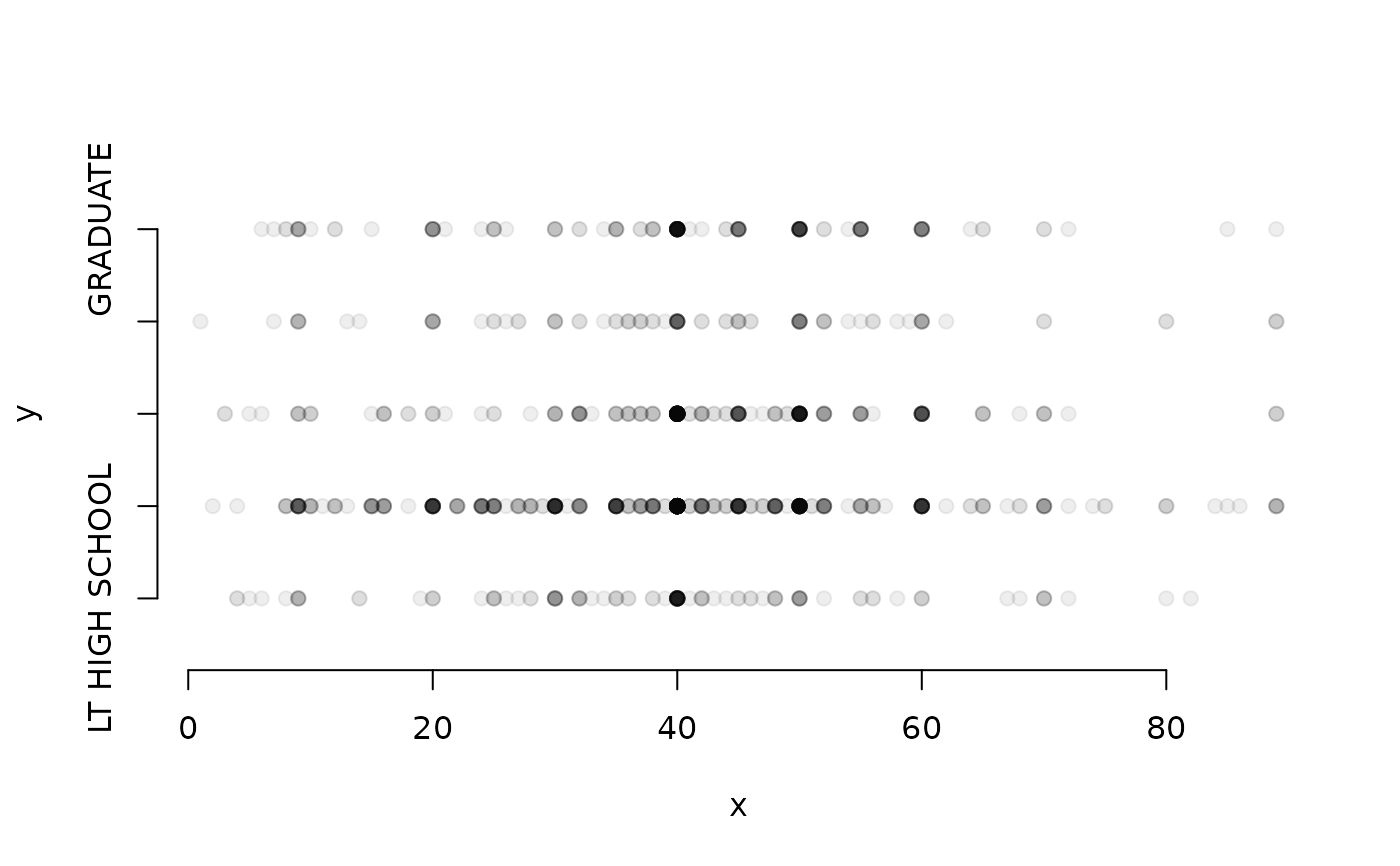
# levels reordered
dotPlot(gss2010_nona$hrs1,
  gss2010_nona$degree,
  col = fadeColor("black", "11"),
  key = c("LT HIGH SCHOOL", "HIGH SCHOOL", "BACHELOR", "JUNIOR COLLEGE", "GRADUATE")
)


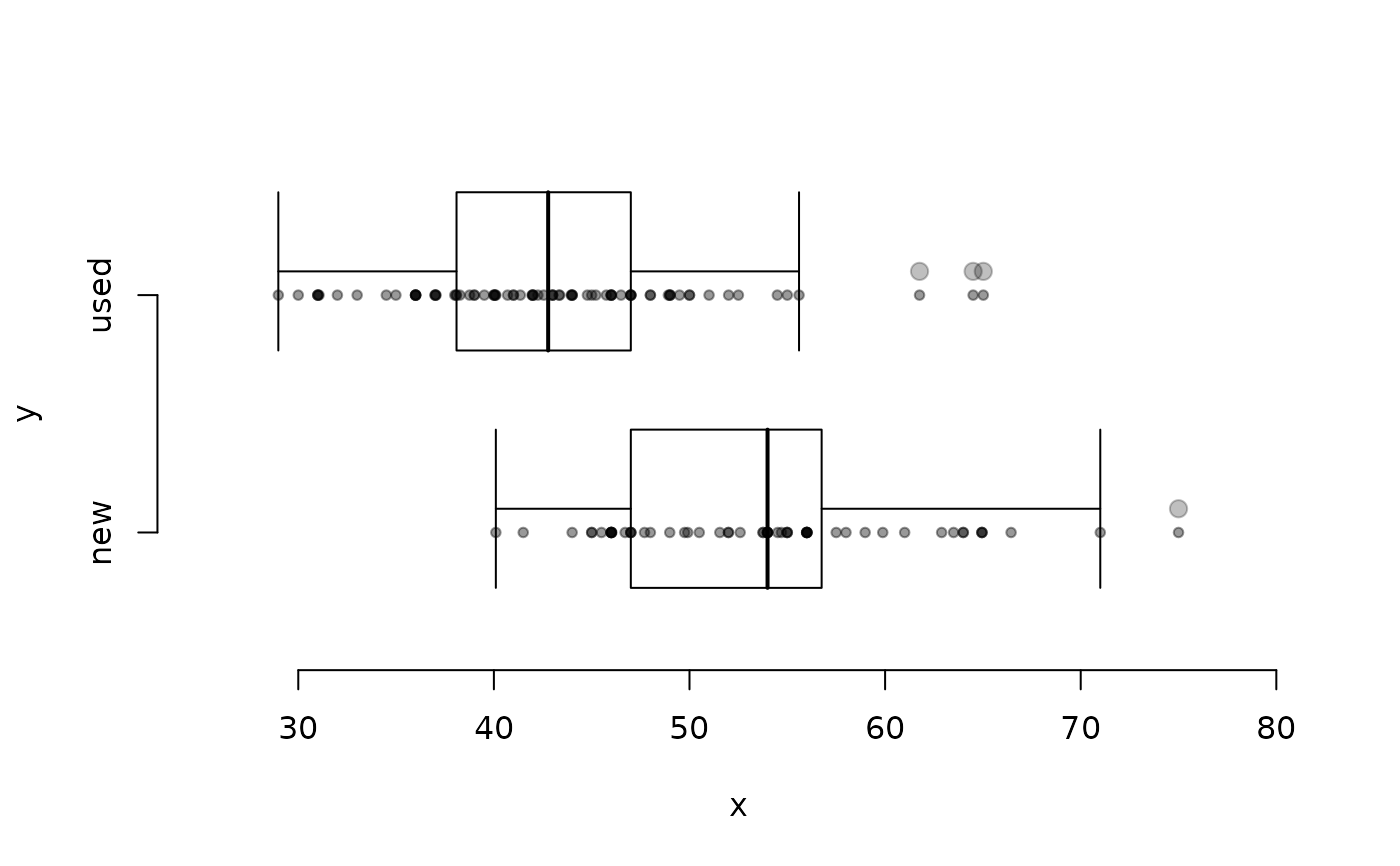
# with boxPlot() overlaid
dotPlot(mariokart$total_pr,
  mariokart$cond,
  ylim = c(0.5, 2.5), xlim = c(25, 80), cex = 1
)
boxPlot(mariokart$total_pr,
  mariokart$cond,
  add = 1:2 + 0.1,
  key = c("new", "used"), horiz = TRUE, axes = FALSE
)

