A simulated dataset of tips over a few weeks on a couple days per week. Each tip is associated with a single group, which may include several bills and tables (i.e. groups paid in one lump sum in simulations).
Format
A data frame with 95 observations on the following 5 variables.
- week
Week number.
- day
Day, either
FridayorTuesday.- n_peop
Number of people associated with the group.
- bill
Total bill for the group.
- tip
Total tip from the group.
Details
This dataset was built using simulations of tables, then bills, then tips based on the bills. Large groups were assumed to only pay the gratuity, which is evident in the data. Tips were set to be plausible round values; they were often (but not always) rounded to dollars, quarters, etc.
Examples
library(ggplot2)
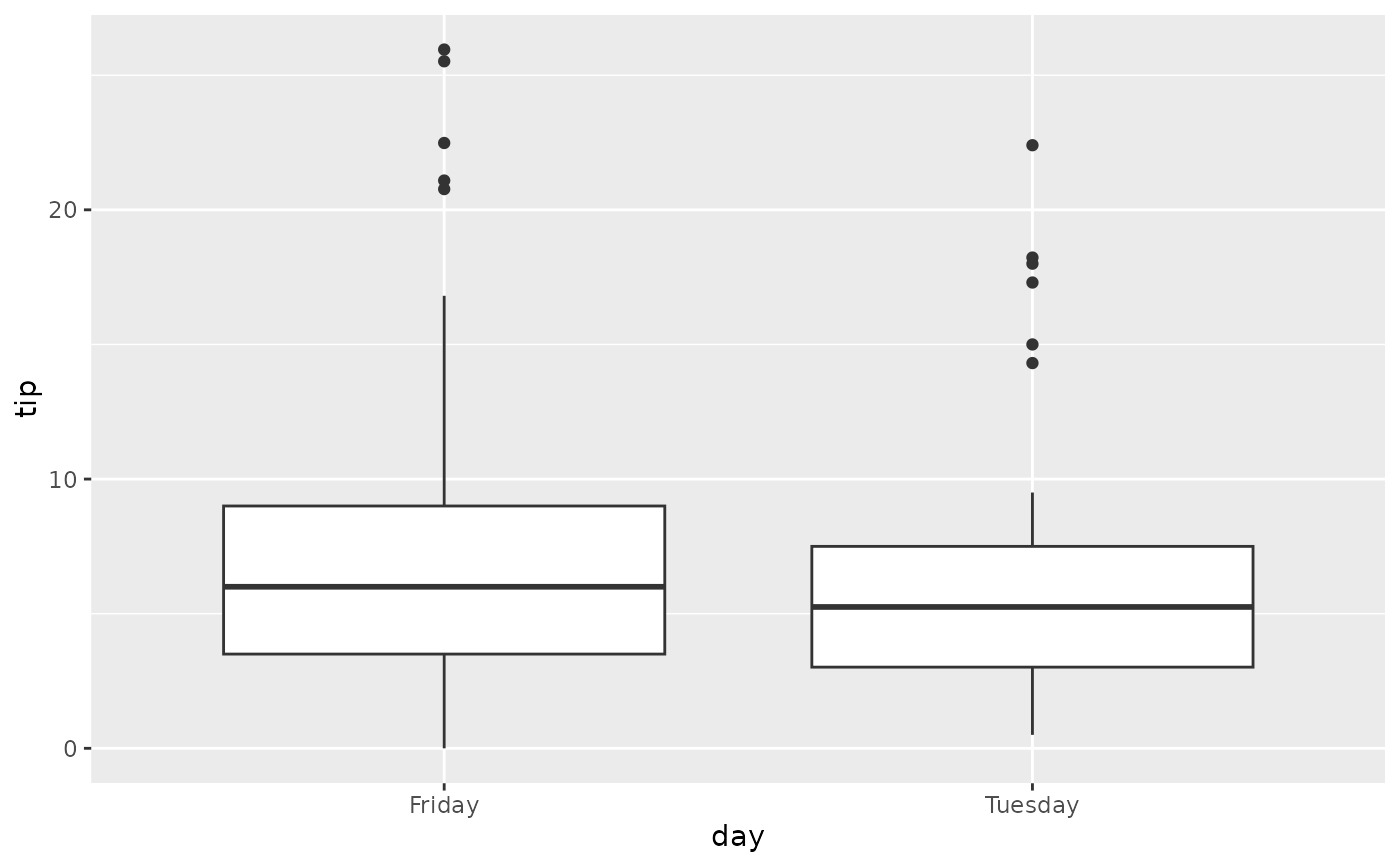
ggplot(tips, aes(x = day, y = tip)) +
geom_boxplot()
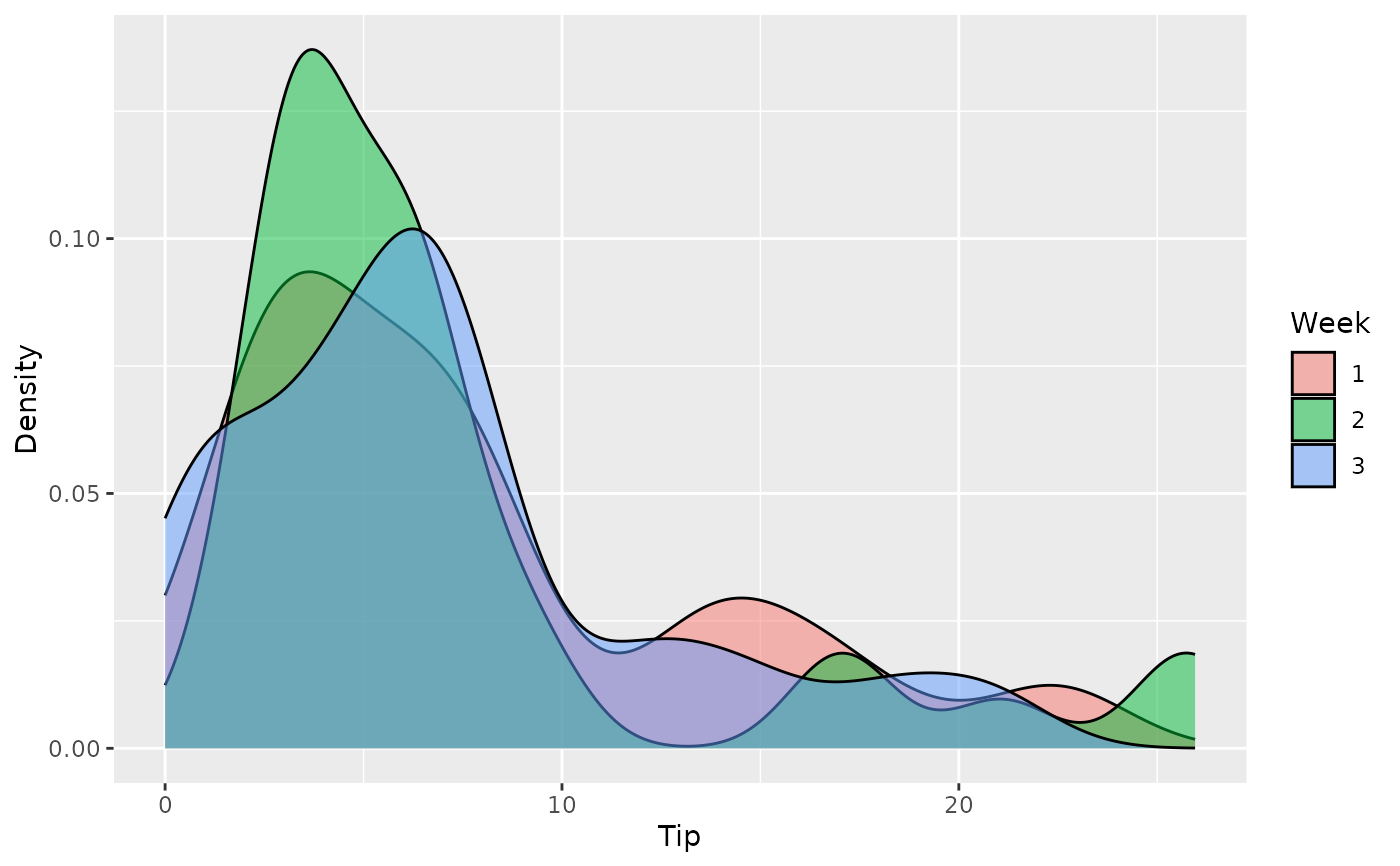
 ggplot(tips, aes(x = tip, fill = factor(week))) +
geom_density(alpha = 0.5) +
labs(x = "Tip", y = "Density", fill = "Week")
ggplot(tips, aes(x = tip, fill = factor(week))) +
geom_density(alpha = 0.5) +
labs(x = "Tip", y = "Density", fill = "Week")
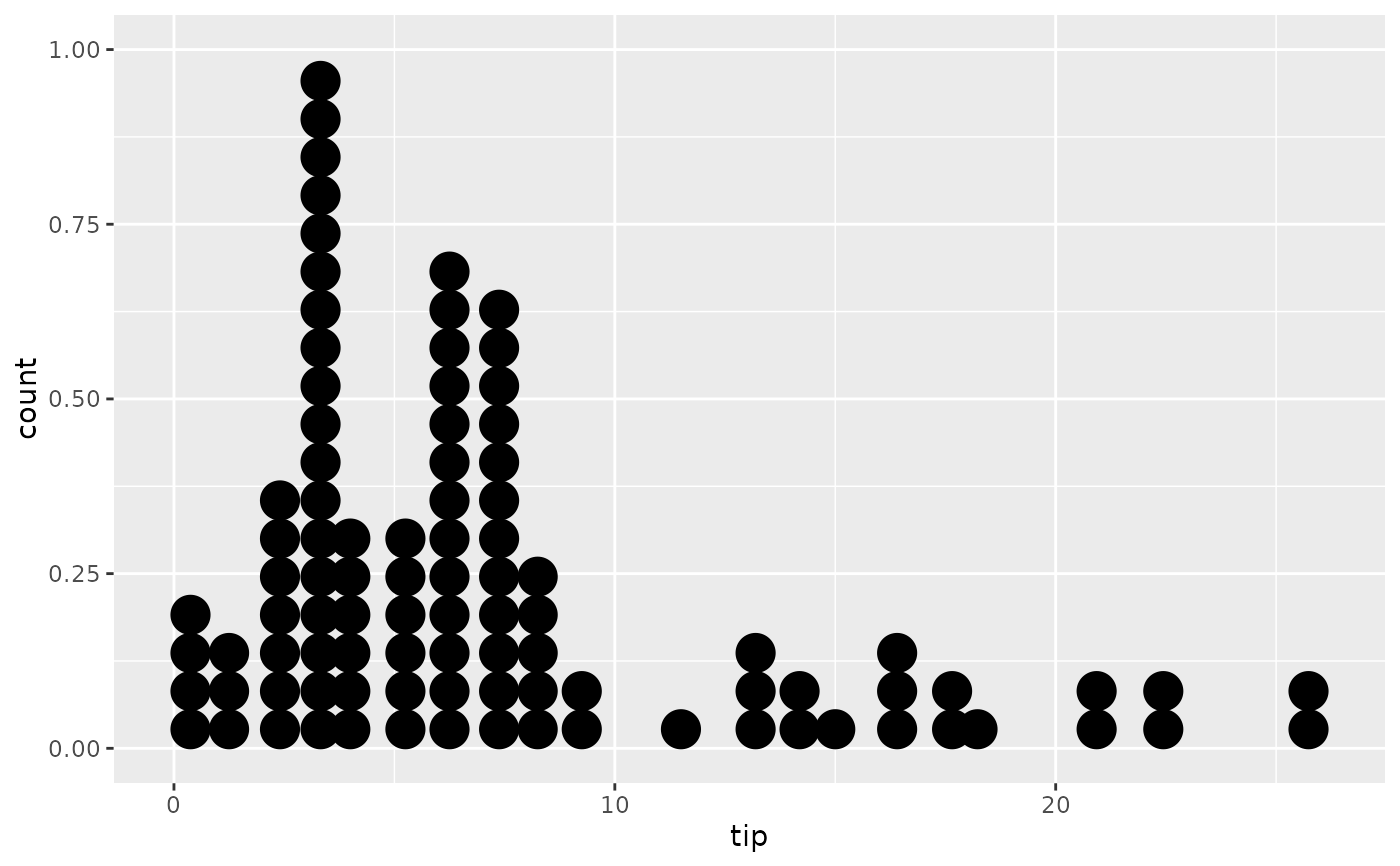
 ggplot(tips, aes(x = tip)) +
geom_dotplot()
#> Bin width defaults to 1/30 of the range of the data. Pick better value with
#> `binwidth`.
ggplot(tips, aes(x = tip)) +
geom_dotplot()
#> Bin width defaults to 1/30 of the range of the data. Pick better value with
#> `binwidth`.
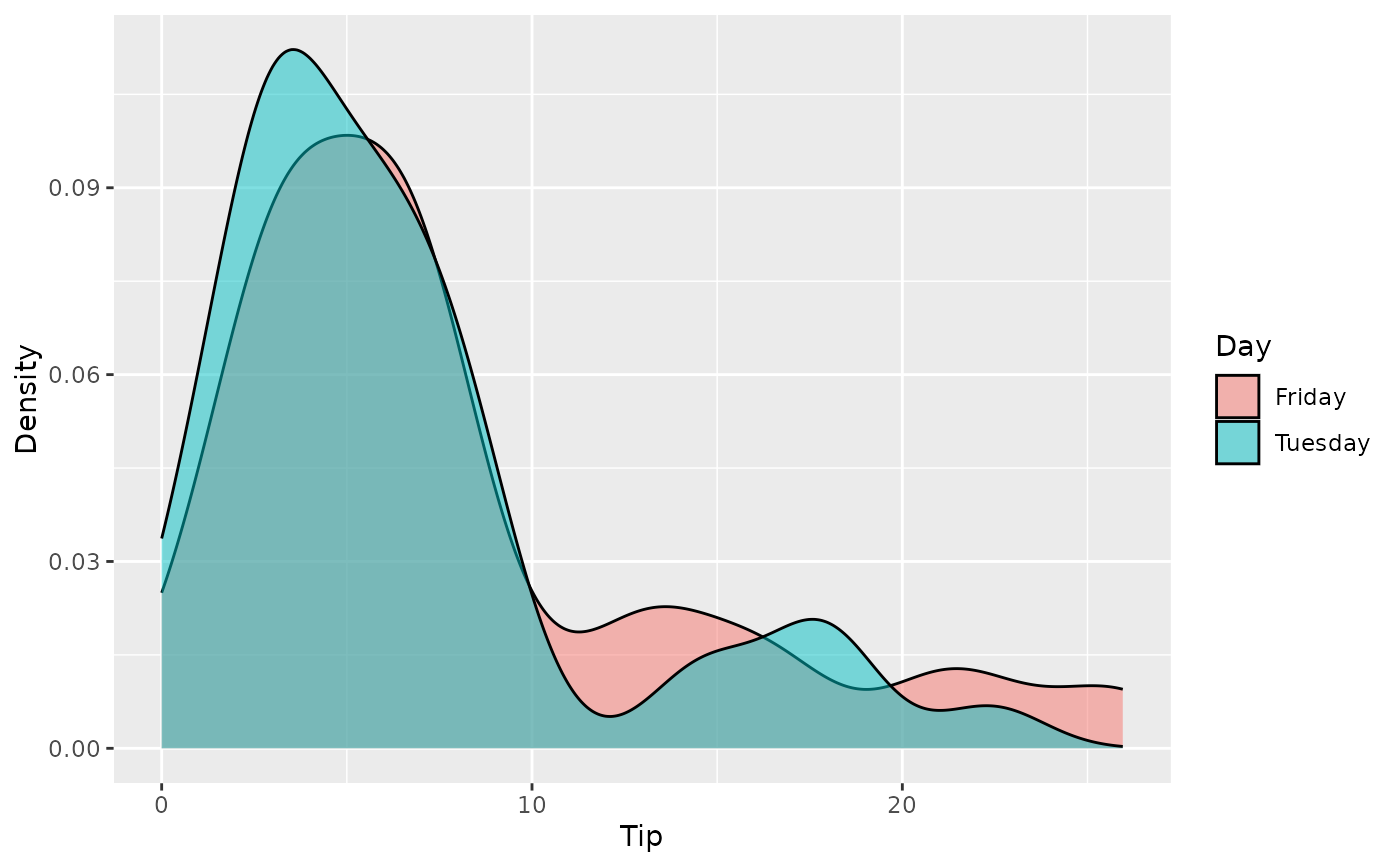
 ggplot(tips, aes(x = tip, fill = factor(day))) +
geom_density(alpha = 0.5) +
labs(x = "Tip", y = "Density", fill = "Day")
ggplot(tips, aes(x = tip, fill = factor(day))) +
geom_density(alpha = 0.5) +
labs(x = "Tip", y = "Density", fill = "Day")