A random sample was taken of nearly 10\ textbook for each course was identified, and its new price at the UCLA Bookstore and on Amazon.com were recorded.
Format
A data frame with 73 observations on the following 7 variables.
- dept_abbr
Course department (abbreviated).
- course
Course number.
- isbn
Book ISBN.
- ucla_new
New price at the UCLA Bookstore.
- amaz_new
New price on Amazon.com.
- more
Whether additional books were required for the course (
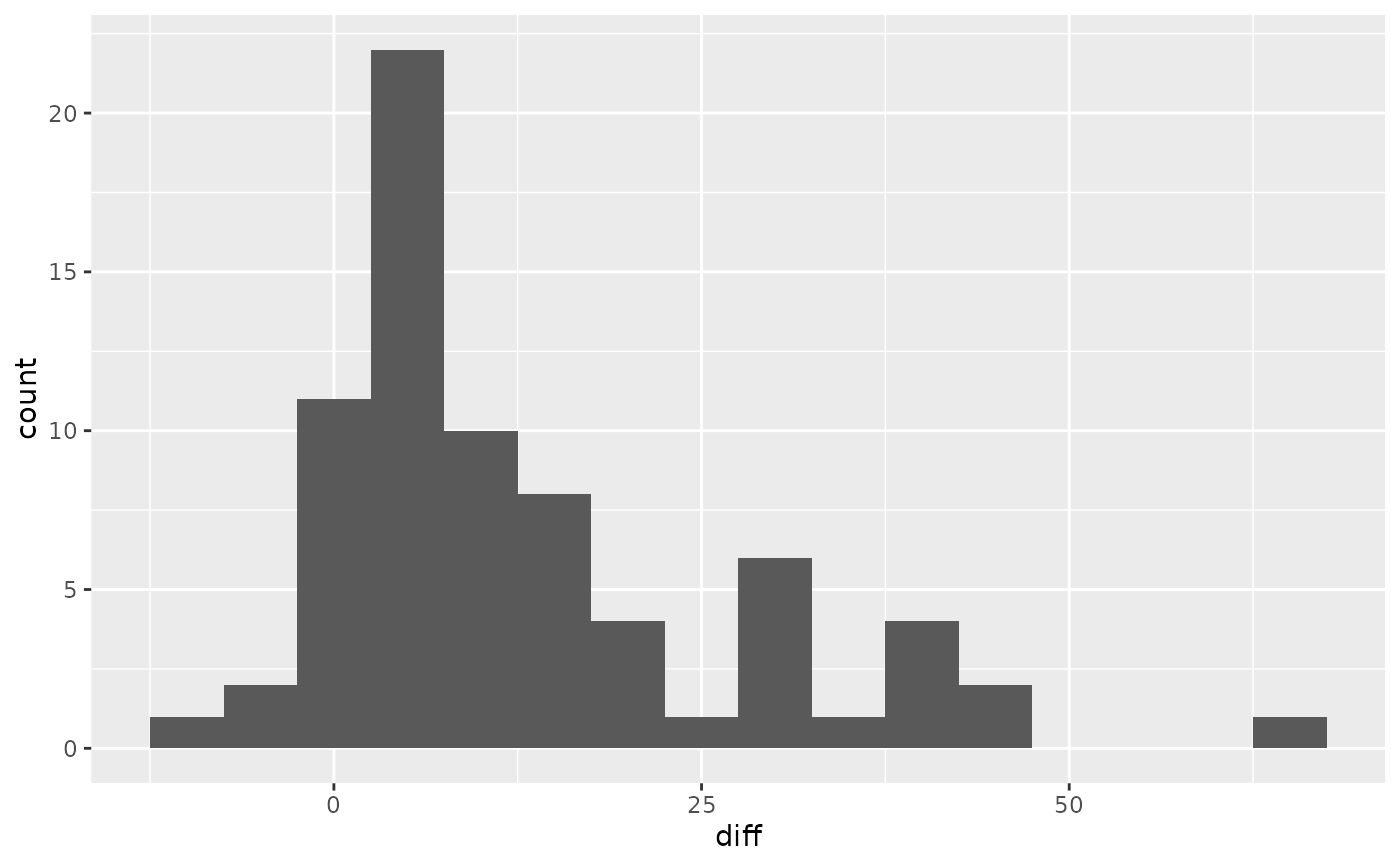
Ymeans "yes, additional books were required").- diff
The UCLA Bookstore price minus the Amazon.com price for each book.
Details
The sample represents only courses where textbooks were listed online
through UCLA Bookstore's website. The most expensive textbook was selected
based on the UCLA Bookstore price, which may insert bias into the data; for
this reason, it may be beneficial to analyze only the data where more
is "N".
Examples
library(ggplot2)

ggplot(textbooks, aes(x = diff)) +
  geom_histogram(binwidth = 5)


t.test(textbooks$diff)
#>
#> 	One Sample t-test
#>
#> data:  textbooks$diff
#> t = 7.6488, df = 72, p-value = 0.00000000006928
#> alternative hypothesis: true mean is not equal to 0
#> 95 percent confidence interval:
#>   9.435636 16.087652
#> sample estimates:
#> mean of x
#>  12.76164
#>
t.test(textbooks$diff)
#>
#> One Sample t-test
#>
#> data: textbooks$diff
#> t = 7.6488, df = 72, p-value = 0.00000000006928
#> alternative hypothesis: true mean is not equal to 0
#> 95 percent confidence interval:
#> 9.435636 16.087652
#> sample estimates:
#> mean of x
#> 12.76164
#>