This dataset contains teacher salaries from 2009-2010 for 71 teachers employed by the St. Louis Public School in Michigan, as well as several covariates.
Format
A data frame with 71 observations on the following 8 variables.
- id
Identification code for each teacher, assigned randomly.
- degree
Highest educational degree attained:
BA(bachelor's degree) orMA(master's degree).- fte
Full-time enrollment status: full-time
1or part-time0.5.- years
Number of years employed by the school district.
- base
Base annual salary, in dollars.
- fica
Amount paid into Social Security and Medicare per year through the Federal Insurance Contribution Act (FICA), in dollars.
- retirement
Amount paid into the retirement fund of the teacher per year, in dollars.
- total
Total annual salary of the teacher, resulting from the sum of base salary + fica + retirement, in dollars.
Examples
library(ggplot2)
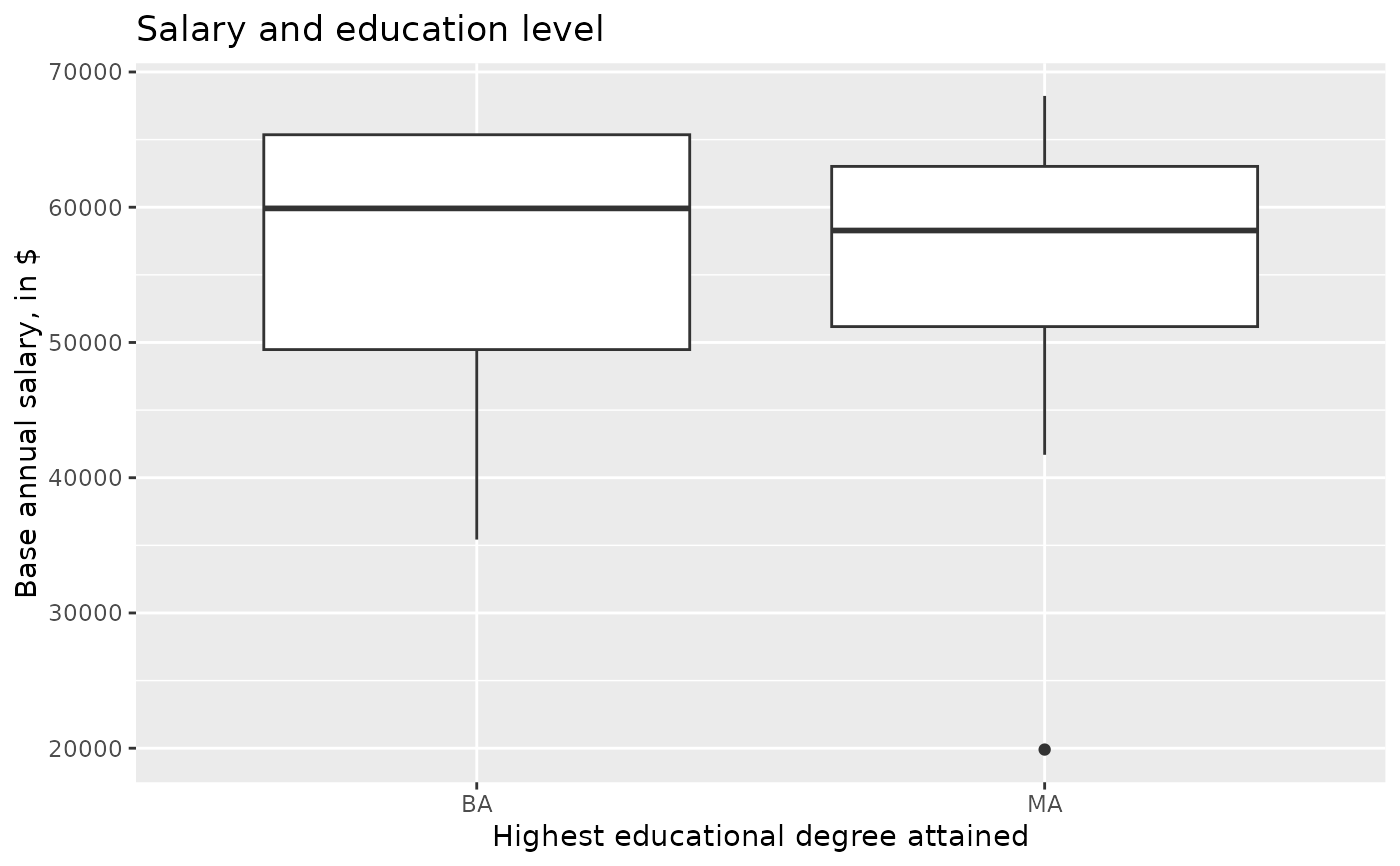
# Salary and education level
ggplot(teacher, aes(x = degree, y = base)) +
geom_boxplot() +
labs(
x = "Highest educational degree attained",
y = "Base annual salary, in $",
color = "Degree",
title = "Salary and education level"
)
#> Ignoring unknown labels:
#> • colour : "Degree"
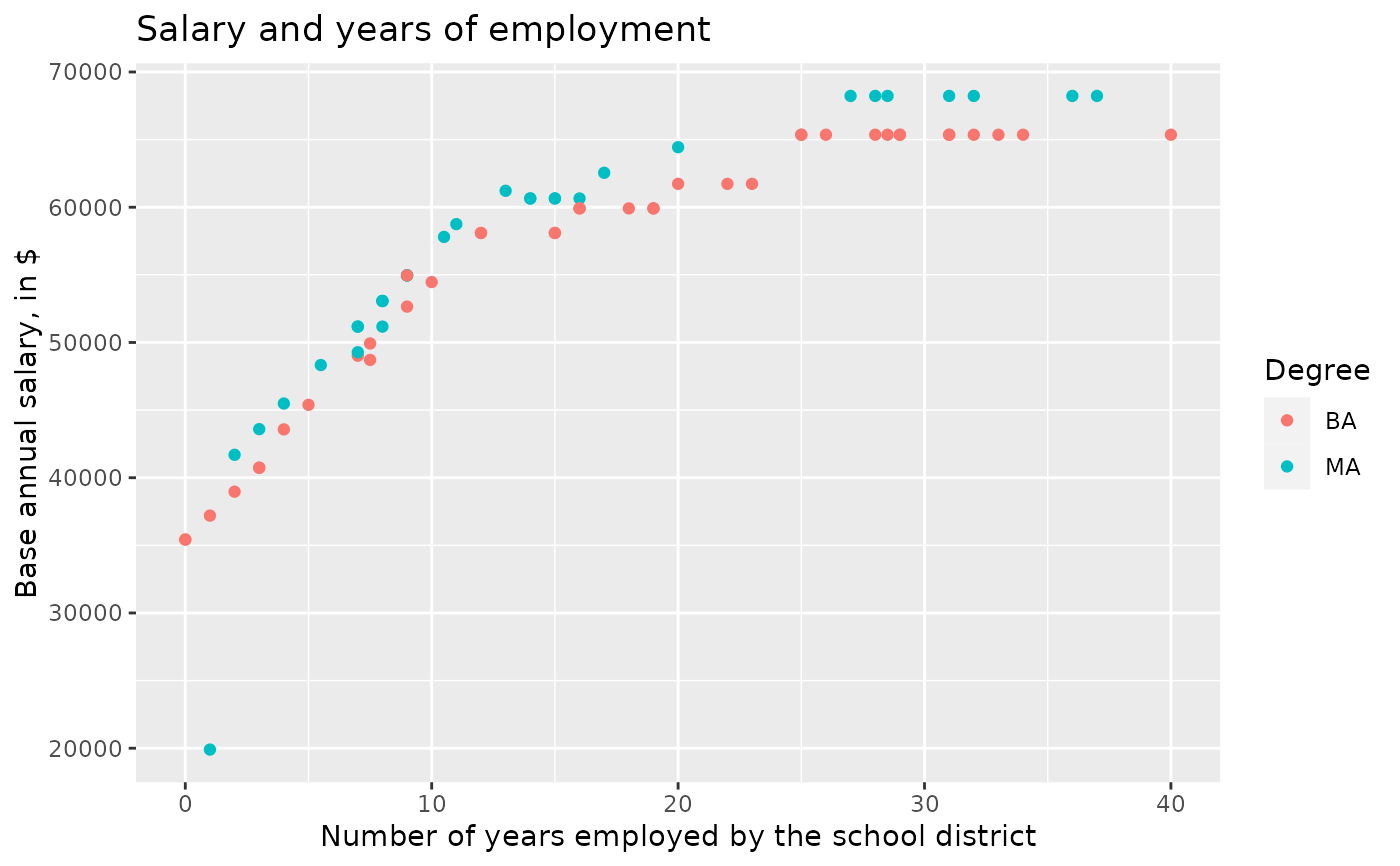
 # Salary and years of employment
ggplot(teacher, aes(x = years, y = base, color = degree)) +
geom_point() +
labs(
x = "Number of years employed by the school district",
y = "Base annual salary, in $",
color = "Degree",
title = "Salary and years of employment"
)
# Salary and years of employment
ggplot(teacher, aes(x = years, y = base, color = degree)) +
geom_point() +
labs(
x = "Number of years employed by the school district",
y = "Base annual salary, in $",
color = "Degree",
title = "Salary and years of employment"
)