User submitted data on 1TB solid state drives (SSD).
Format
A data frame with 54 rows and 7 variables.
- brand
Brand name of the drive.
- model
Model name of the drive.
- samples
Number of user submitted benchmarks.
- form_factor
Physical form of the drive with levels
2.5,m.2, andmSATA.- nvme
If a drive uses the nvme protocol this value is 1, 0 if it does not.
- read
Average read speed from user benchmarks in MB/s.
- write
Average write speed from user benchmarks in MB/s.
Source
UserBenchmark, retrieved September 1, 2020.
Examples
library(ggplot2)
library(dplyr)
ssd_speed |>
count(form_factor)
#> # A tibble: 3 × 2
#> form_factor n
#> <chr> <int>
#> 1 2.5 21
#> 2 m.2 32
#> 3 mSATA 1
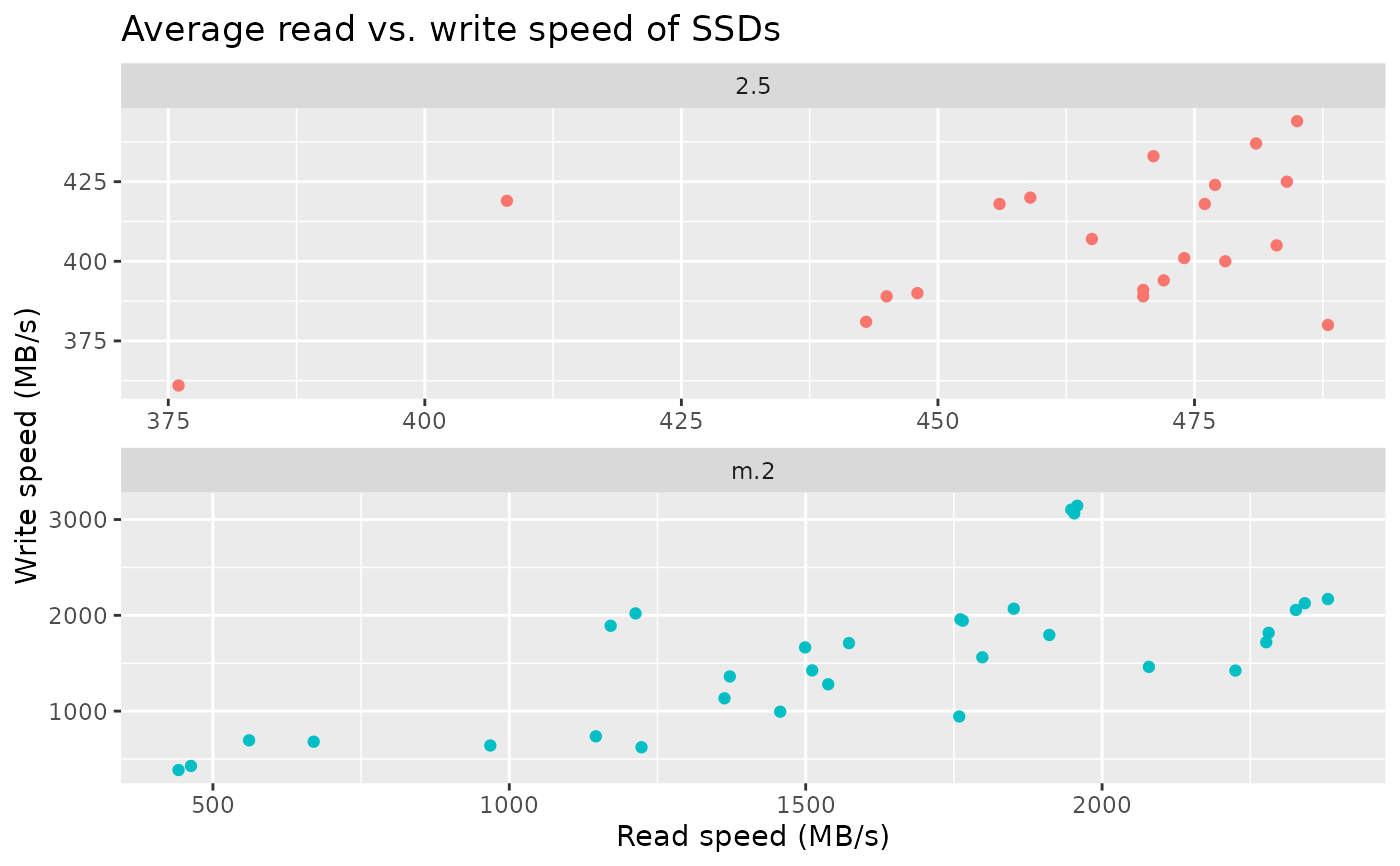
ssd_speed |>
filter(form_factor != "mSATA") |>
ggplot(aes(x = read, y = write, color = form_factor)) +
geom_point() +
labs(
title = "Average read vs. write speed of SSDs",
x = "Read speed (MB/s)",
y = "Write speed (MB/s)"
) +
facet_wrap(~form_factor, ncol = 1, scales = "free") +
guides(color = FALSE)
#> Warning: The `<scale>` argument of `guides()` cannot be `FALSE`. Use "none" instead as
#> of ggplot2 3.3.4.