Fifty companies were randomly sampled from the 500 companies in the S&P 500, and their financial information was collected on March 8, 2012.
Format
A data frame with 50 observations on the following 12 variables.
- market_cap
Total value of all company shares, in millions of dollars.
- stock
The name of the stock (e.g.
AAPLfor Apple).- ent_value
Enterprise value, which is an alternative to market cap that also accounts for things like cash and debt, in millions of dollars.
- trail_pe
The market cap divided by the earnings (profits) over the last year.
- forward_pe
The market cap divided by the forecasted earnings (profits) over the next year.
- ev_over_rev
Enterprise value divided by the company's revenue.
- profit_margin
Percent of earnings that are profits.
- revenue
Revenue, in millions of dollars.
- growth
Quartly revenue growth (year over year), in millions of dollars.
- earn_before
Earnings before interest, taxes, depreciation, and amortization, in millions of dollars.
- cash
Total cash, in millions of dollars.
- debt
Total debt, in millions of dollars.
Examples
library(ggplot2)
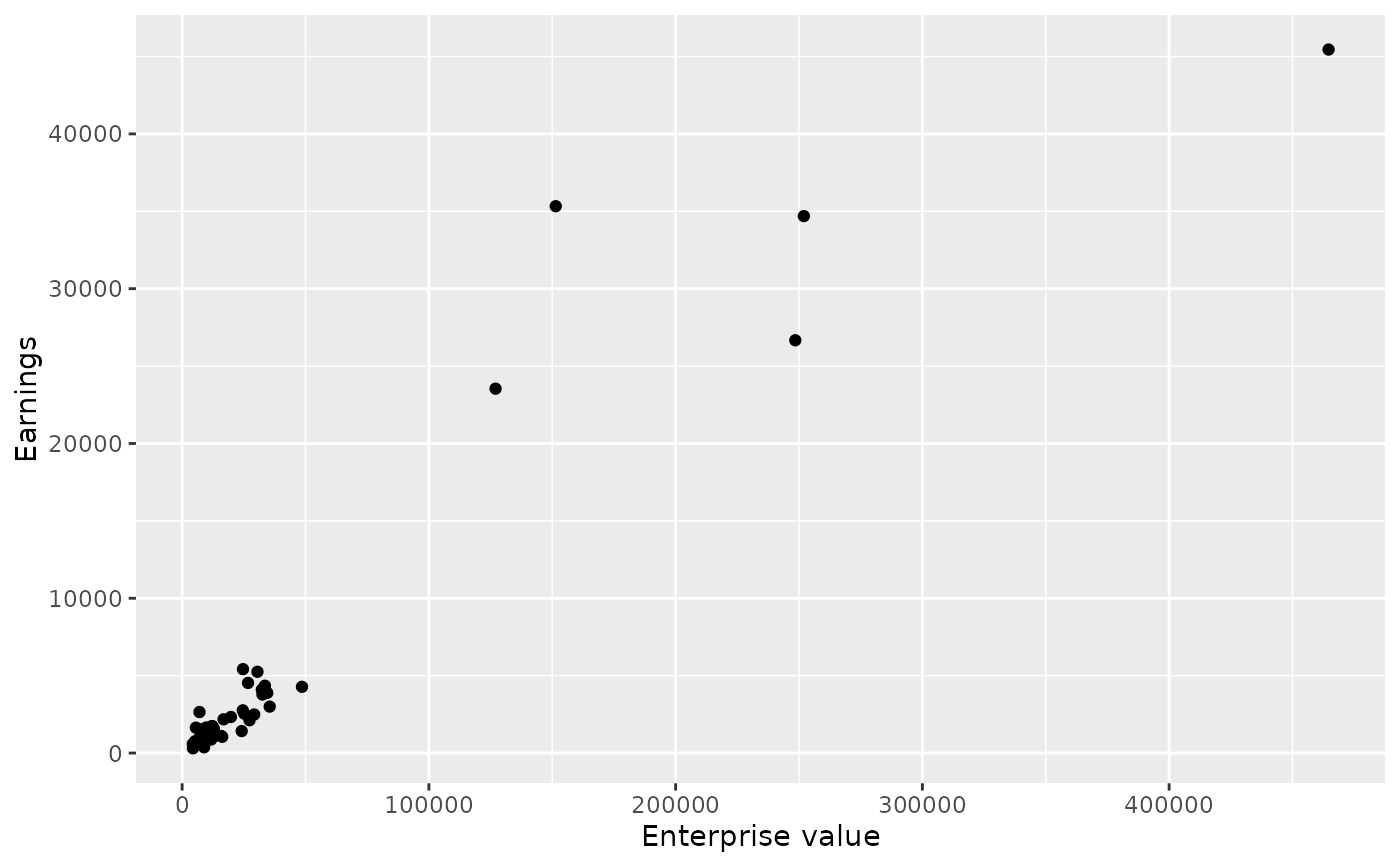
ggplot(sp500, aes(x = ent_value, y = earn_before)) +
geom_point() +
labs(x = "Enterprise value", y = "Earnings")
#> Warning: Removed 3 rows containing missing values or values outside the scale range
#> (`geom_point()`).
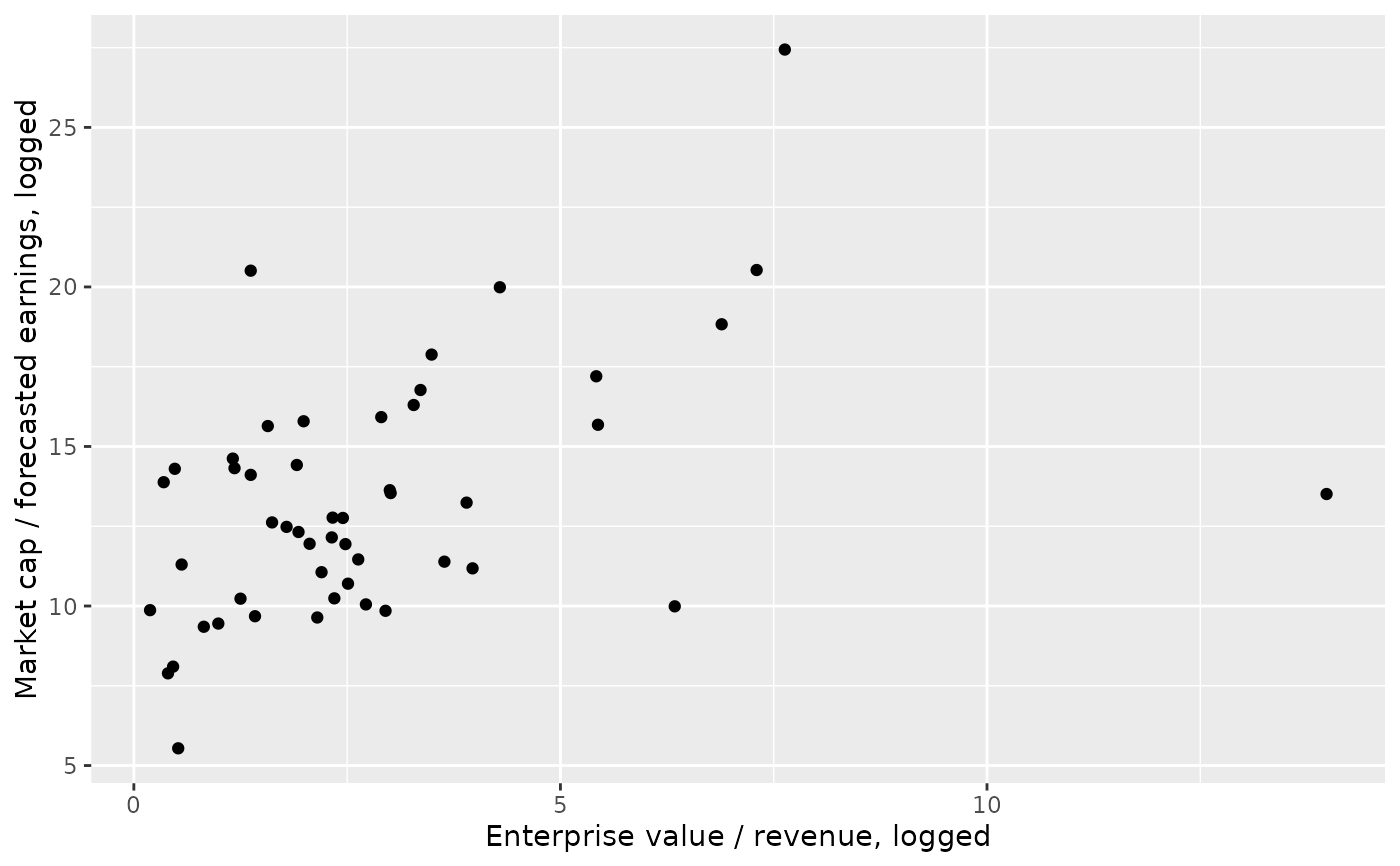
 ggplot(sp500, aes(x = ev_over_rev, y = forward_pe)) +
geom_point() +
labs(
x = "Enterprise value / revenue, logged",
y = "Market cap / forecasted earnings, logged"
)
ggplot(sp500, aes(x = ev_over_rev, y = forward_pe)) +
geom_point() +
labs(
x = "Enterprise value / revenue, logged",
y = "Market cap / forecasted earnings, logged"
)
 ggplot(sp500, aes(x = ent_value, y = earn_before)) +
geom_point() +
scale_x_log10() +
scale_y_log10() +
labs(x = "Enterprise value", y = "Earnings")
#> Warning: Removed 3 rows containing missing values or values outside the scale range
#> (`geom_point()`).
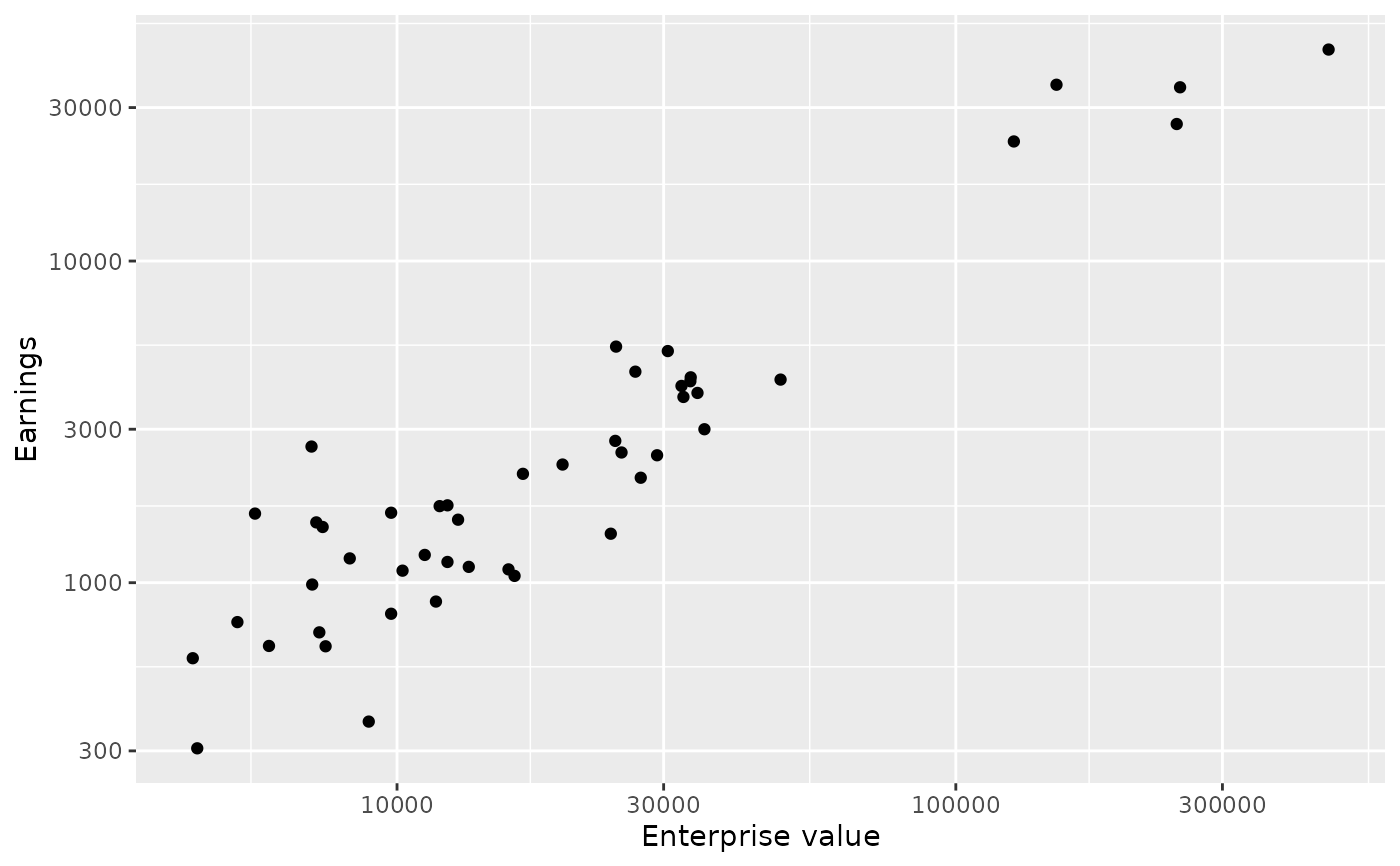
ggplot(sp500, aes(x = ent_value, y = earn_before)) +
geom_point() +
scale_x_log10() +
scale_y_log10() +
labs(x = "Enterprise value", y = "Earnings")
#> Warning: Removed 3 rows containing missing values or values outside the scale range
#> (`geom_point()`).
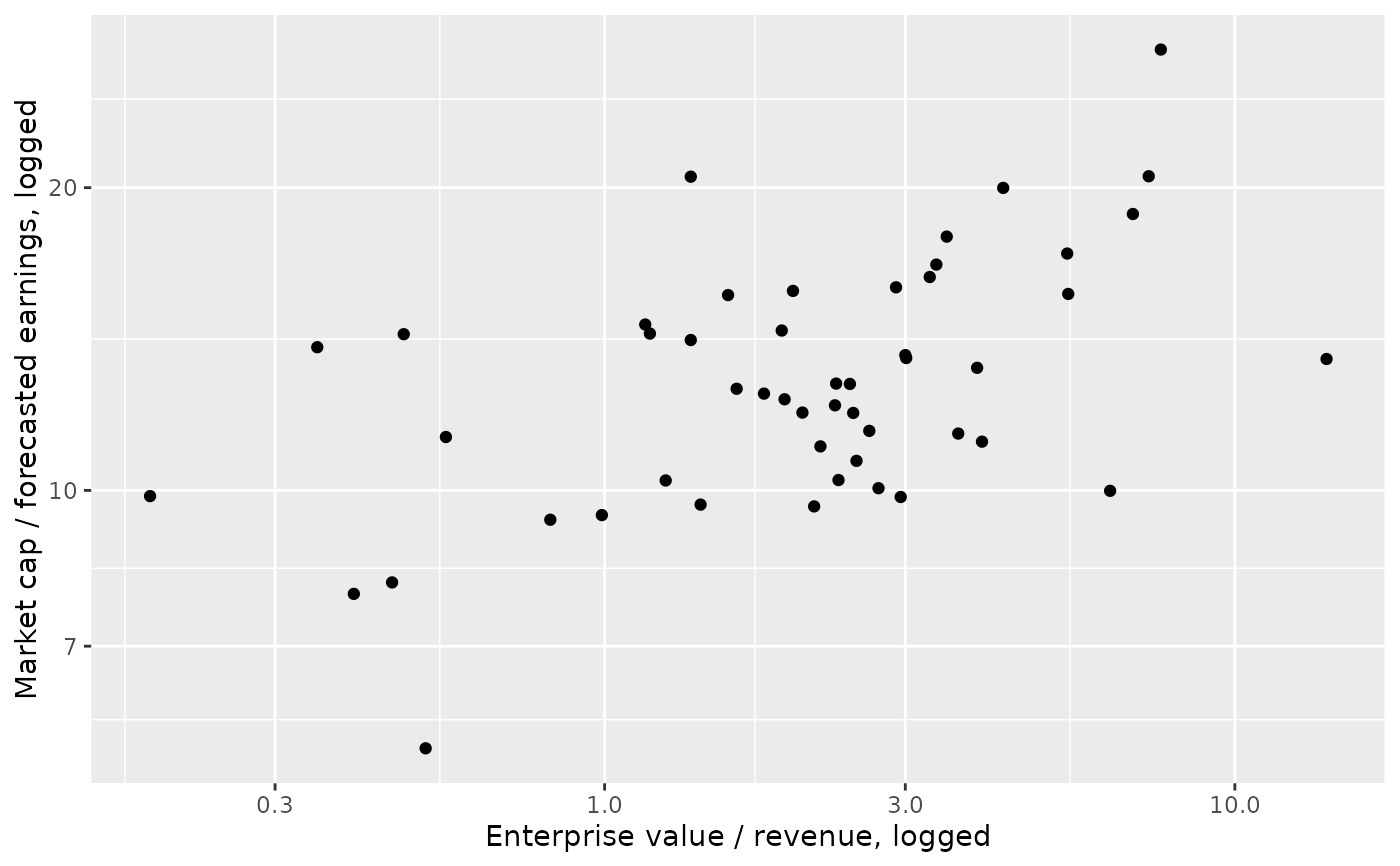
 ggplot(sp500, aes(x = ev_over_rev, y = forward_pe)) +
geom_point() +
scale_x_log10() +
scale_y_log10() +
labs(
x = "Enterprise value / revenue, logged",
y = "Market cap / forecasted earnings, logged"
)
ggplot(sp500, aes(x = ev_over_rev, y = forward_pe)) +
geom_point() +
scale_x_log10() +
scale_y_log10() +
labs(
x = "Enterprise value / revenue, logged",
y = "Market cap / forecasted earnings, logged"
)