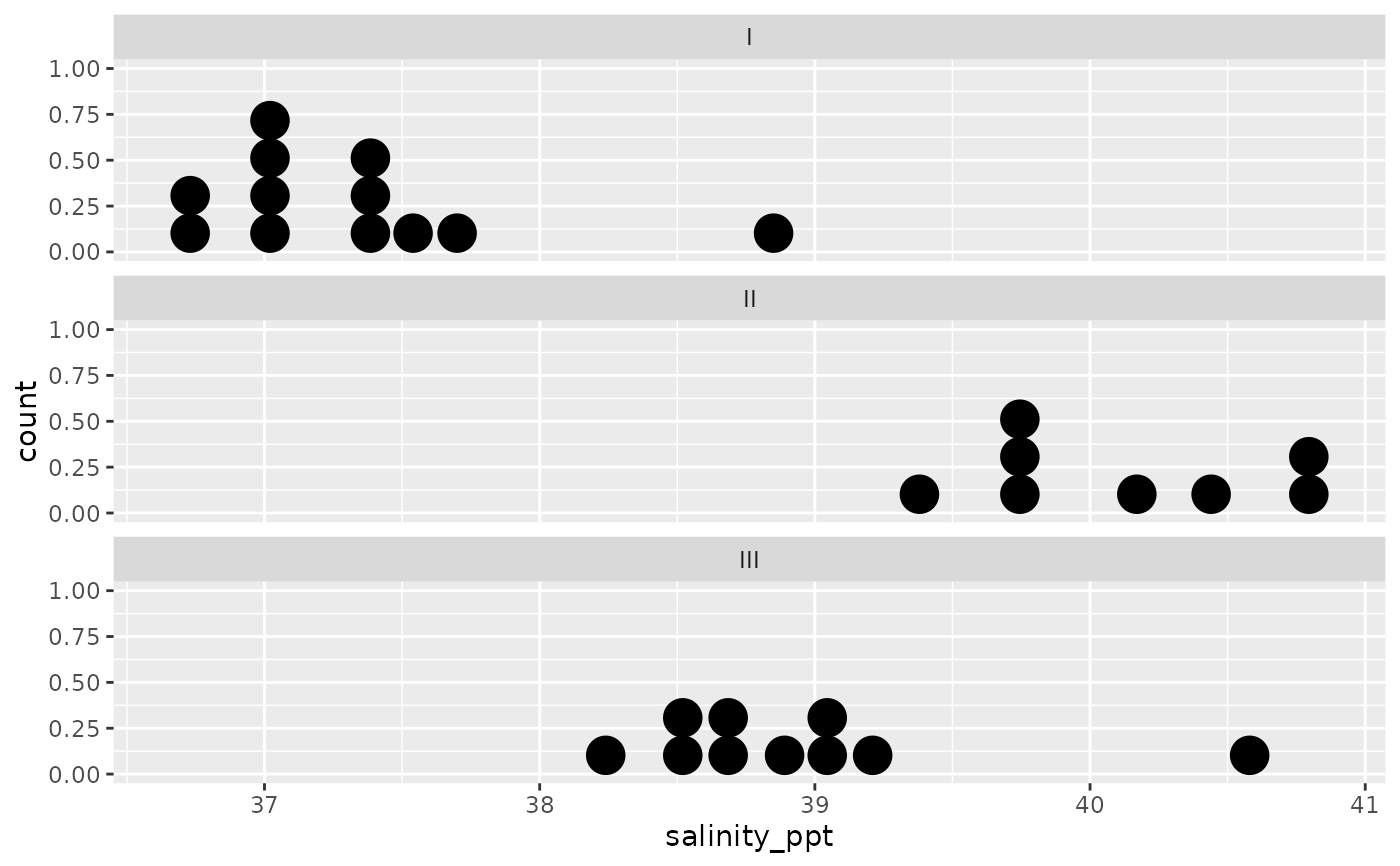
Data collected at three different water masses in the Bimini Lagoon, Bahamas.
Format
A data frame with 30 rows and 2 variables.
- site_number
Location where measurements were taken.
- salinity_ppt
Salinity value in parts per thousand.
Source
Till, R. (1974) Statistical Methods for the Earth Scientist: An Introduction. London: Macmillon, 104.
Examples
library(ggplot2)
library(broom)

ggplot(salinity, aes(x = salinity_ppt)) +
  geom_dotplot() +
  facet_wrap(~site_number, ncol = 1)
#> Bin width defaults to 1/30 of the range of the data. Pick better value with
#> `binwidth`.


tidy(aov(salinity_ppt ~ site_number, data = salinity))
#> # A tibble: 2 × 6
#>   term           df sumsq meansq statistic   p.value
#>   <chr>       <dbl> <dbl>  <dbl>     <dbl>     <dbl>
#> 1 site_number     2 39.1  19.6        56.5  2.24e-10
#> 2 Residuals      27  9.35  0.346      NA   NA
tidy(aov(salinity_ppt ~ site_number, data = salinity))
#> # A tibble: 2 × 6
#> term df sumsq meansq statistic p.value
#> <chr> <dbl> <dbl> <dbl> <dbl> <dbl>
#> 1 site_number 2 39.1 19.6 56.5 2.24e-10
#> 2 Residuals 27 9.35 0.346 NA NA