Minneapolis police use of force data.
Source:R/data-mn_police_use_of_force.R
mn_police_use_of_force.RdFrom Minneapolis, data from 2016 through August 2021
Format
A data frame with 12925 rows and 13 variables.
- response_datetime
DateTime of police response.
- problem
Problem that required police response.
- is_911_call
Whether response was iniated by call to 911.
- primary_offense
Offense of subject.
- subject_injury
Whether subject was injured Yes/No/null.
- force_type
Type of police force used.
- force_type_action
Detail of police force used.
- race
Race of subject.
- sex
Gender of subject.
- age
Age of subject.
- type_resistance
Resistance to police by subject.
- precinct
Precinct where response occurred.
- neighborhood
Neighborhood where response occurred.
Examples
library(dplyr)
library(ggplot2)
# List percent of total for each race
mn_police_use_of_force |>
count(race) |>
mutate(percent = round(n / sum(n) * 100, 2)) |>
arrange(desc(percent))
#> race n percent
#> 1 Black 7648 59.17
#> 2 White 3129 24.21
#> 3 <NA> 1024 7.92
#> 4 Native American 784 6.07
#> 5 Other / Mixed Race 205 1.59
#> 6 Asian 129 1.00
#> 7 Pacific Islander 6 0.05
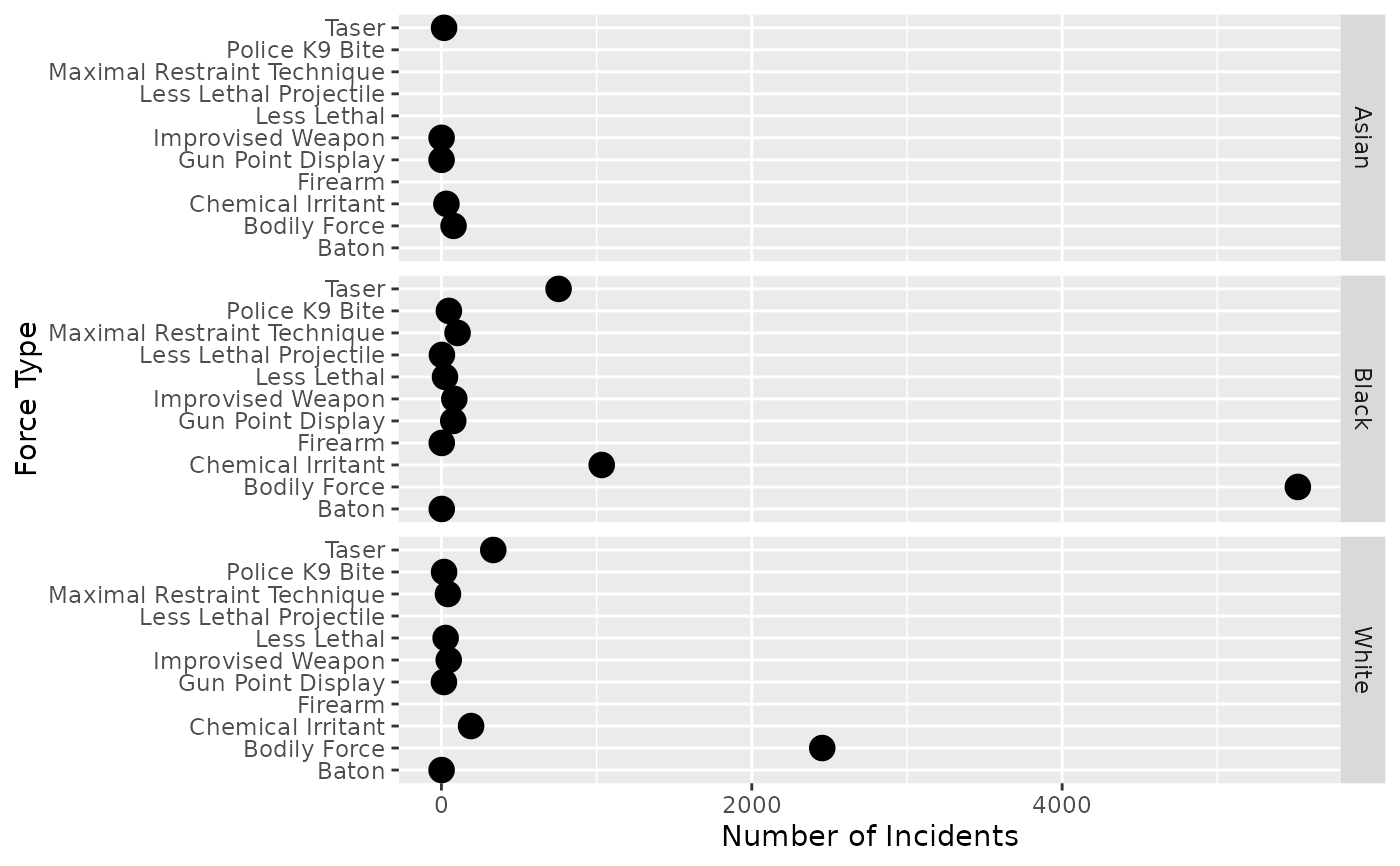
# Display use of force count by three races
race_sub <- c("Asian", "White", "Black")
ggplot(
mn_police_use_of_force |> filter(race %in% race_sub),
aes(force_type, ..count..)
) +
geom_point(stat = "count", size = 4) +
coord_flip() +
facet_grid(race ~ .) +
labs(
x = "Force Type",
y = "Number of Incidents"
)
#> Warning: The dot-dot notation (`..count..`) was deprecated in ggplot2 3.4.0.
#> ℹ Please use `after_stat(count)` instead.