Survey of 218 students, collecting information on their GPAs and their academic major.
Format
A data frame with 218 observations on the following 2 variables.
- gpa
Grade point average (GPA).
- major
Area of academic major.
Examples
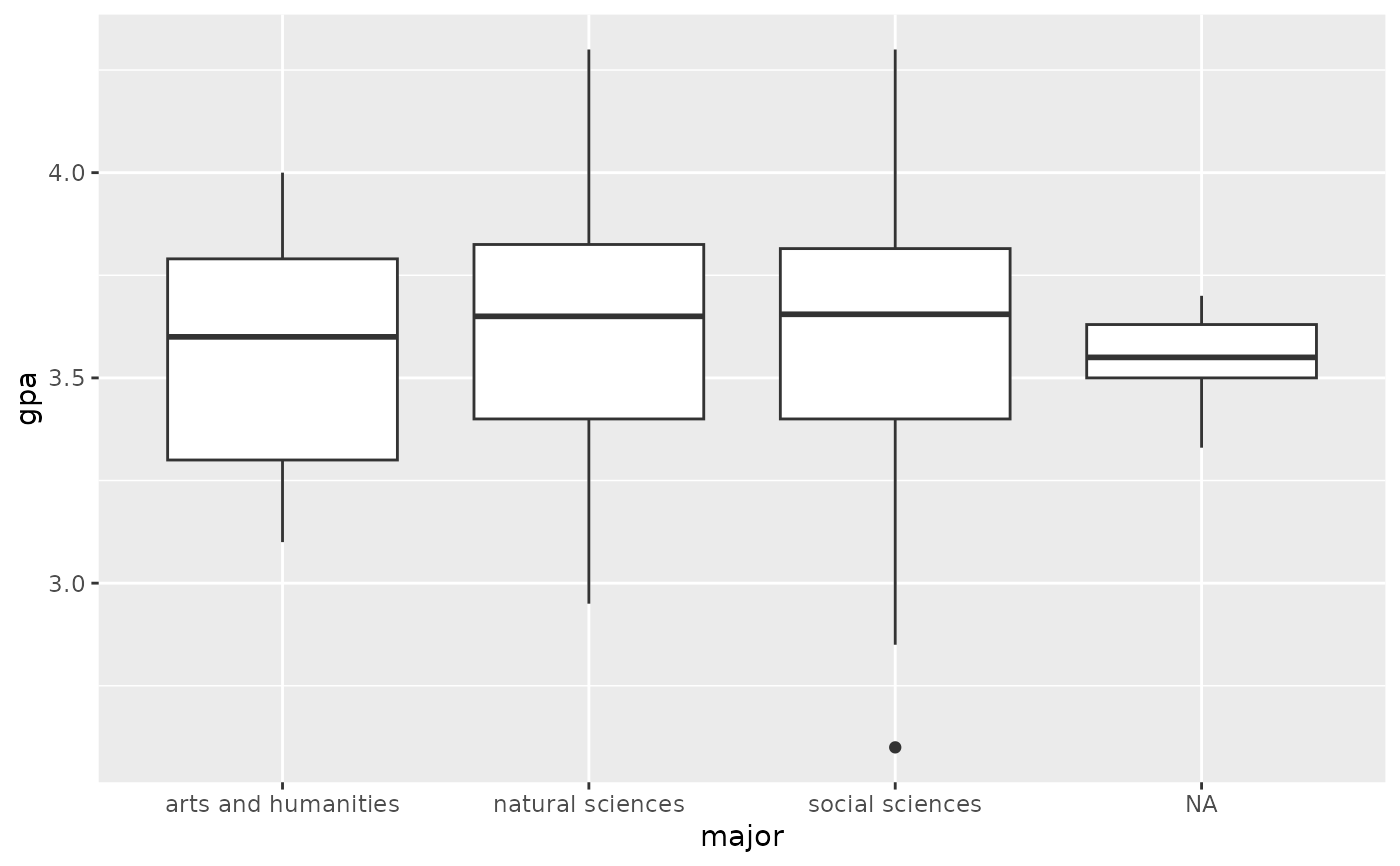
library(ggplot2)

ggplot(major_survey, aes(x = major, y = gpa)) +
  geom_boxplot()
#> Warning: Removed 13 rows containing non-finite outside the scale range
#> (`stat_boxplot()`).