Data on top speeds measured on a laboratory race track for two species of lizards: Western fence lizard (Sceloporus occidentalis) and Sagebrush lizard (Sceloporus graciosus).
Format
A data frame with 48 observations on the following 3 variables.
- top_speed
Top speed of lizard, meters per second.
- common_name
Common name:
Western fence lizardandSagebrush lizard.- scientific_name
Scientific name (Genus and species):
Sceloporus occidentalisandSceloporus graciosus.
Source
Adolph, S. C. 1987. Physiological and behavioral ecology of the lizards Sceloporus occidentalis and Sceloporus graciosus. Dissertation. University of Washington, Seattle, Washington, USA.
Examples
library(ggplot2)
library(dplyr)
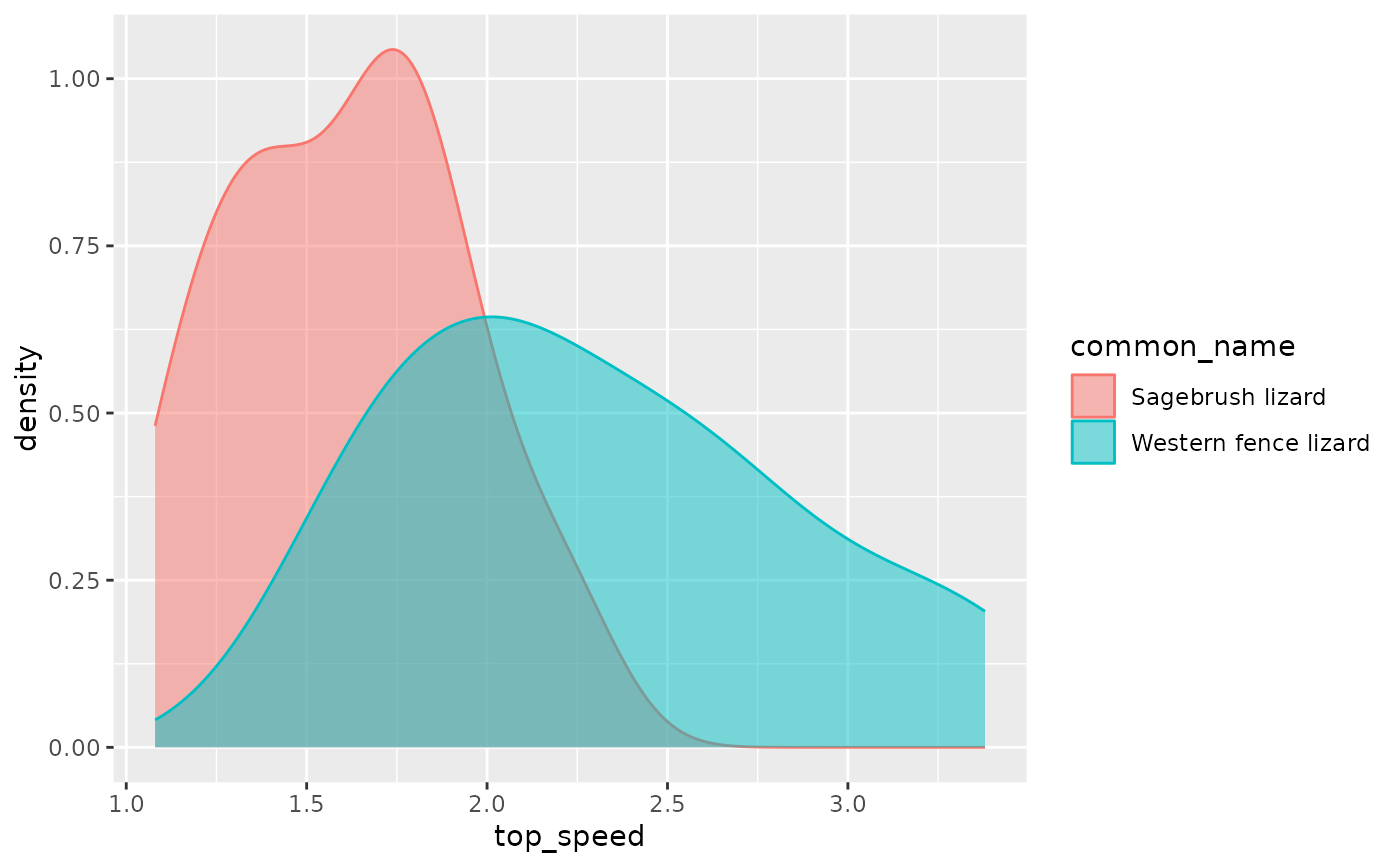
# Top speed by species
ggplot(lizard_run, aes(x = top_speed, color = common_name, fill = common_name)) +
geom_density(alpha = 0.5)
 # Top speed summary statistics by species
lizard_run |>
group_by(common_name) |>
summarise(
n = n(),
mean = mean(top_speed),
sd = sd(top_speed)
)
#> # A tibble: 2 × 4
#> common_name n mean sd
#> <chr> <int> <dbl> <dbl>
#> 1 Sagebrush lizard 26 1.61 0.324
#> 2 Western fence lizard 22 2.31 0.555
# Top speed summary statistics by species
lizard_run |>
group_by(common_name) |>
summarise(
n = n(),
mean = mean(top_speed),
sd = sd(top_speed)
)
#> # A tibble: 2 × 4
#> common_name n mean sd
#> <chr> <int> <dbl> <dbl>
#> 1 Sagebrush lizard 26 1.61 0.324
#> 2 Western fence lizard 22 2.31 0.555