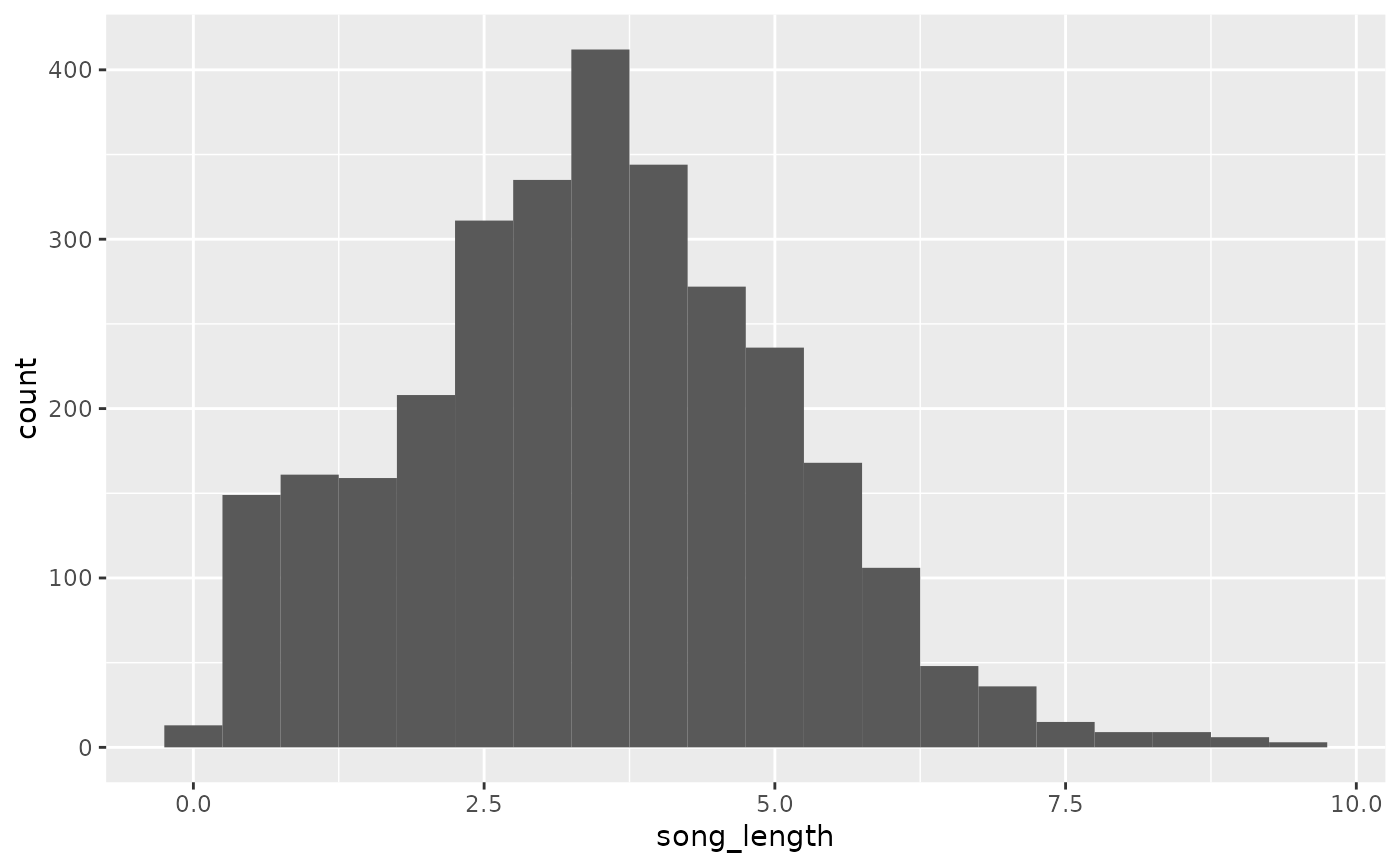
A simulated dataset on lengths of songs on an iPod.
Format
A data frame with 3000 observations on the following variable.
- song_length
Length of song (in minutes).
Examples
library(ggplot2)

ggplot(ipod, aes(x = song_length)) +
  geom_histogram(binwidth = 0.5)

