This entry gives the number of deaths of infants under one year old in 2012 per 1,000 live births in the same year. This rate is often used as an indicator of the level of health in a country.
Format
A data frame with 222 observations on the following 2 variables.
- country
Name of country.
- inf_mort_rate
Infant mortality rate per 1,000 live births.
Source
CIA World Factbook, https://www.cia.gov/the-world-factbook/field/infant-mortality-rate/country-comparison.
Details
The data is given in decreasing order of infant mortality rates. There are a few potential outliers.
Examples
library(ggplot2)
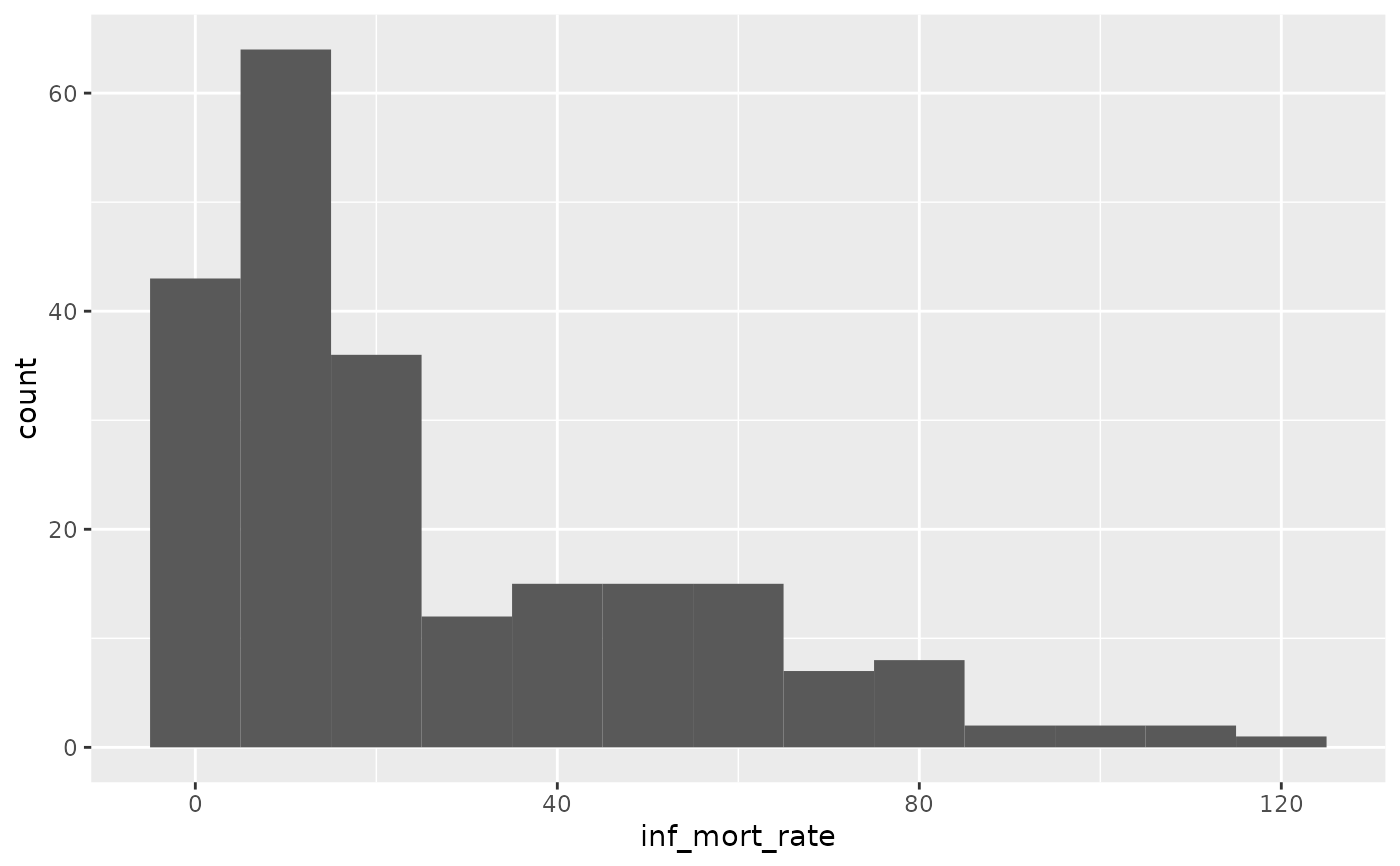
ggplot(infmortrate, aes(x = inf_mort_rate)) +
geom_histogram(binwidth = 10)
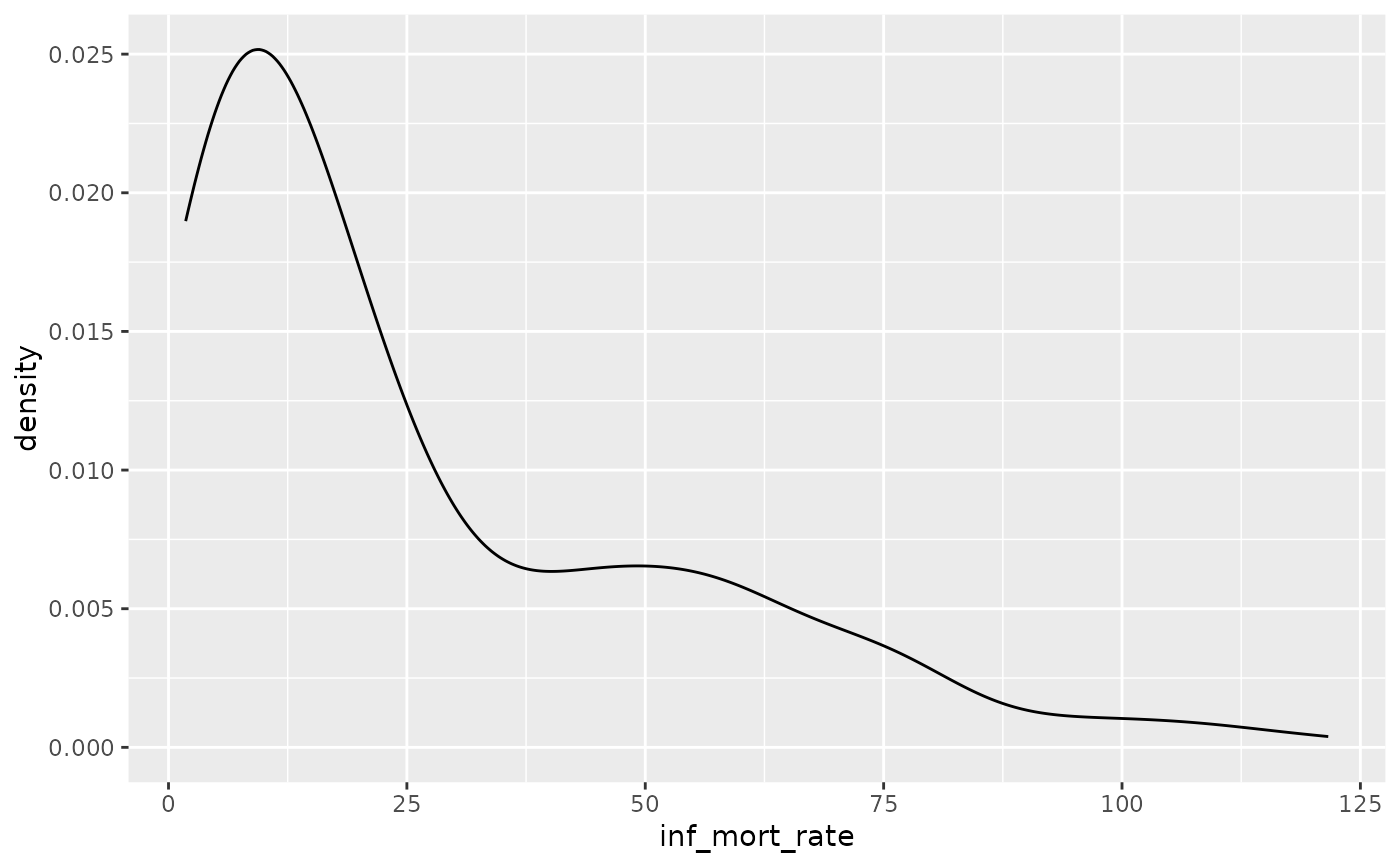
 ggplot(infmortrate, aes(x = inf_mort_rate)) +
geom_density()
ggplot(infmortrate, aes(x = inf_mort_rate)) +
geom_density()