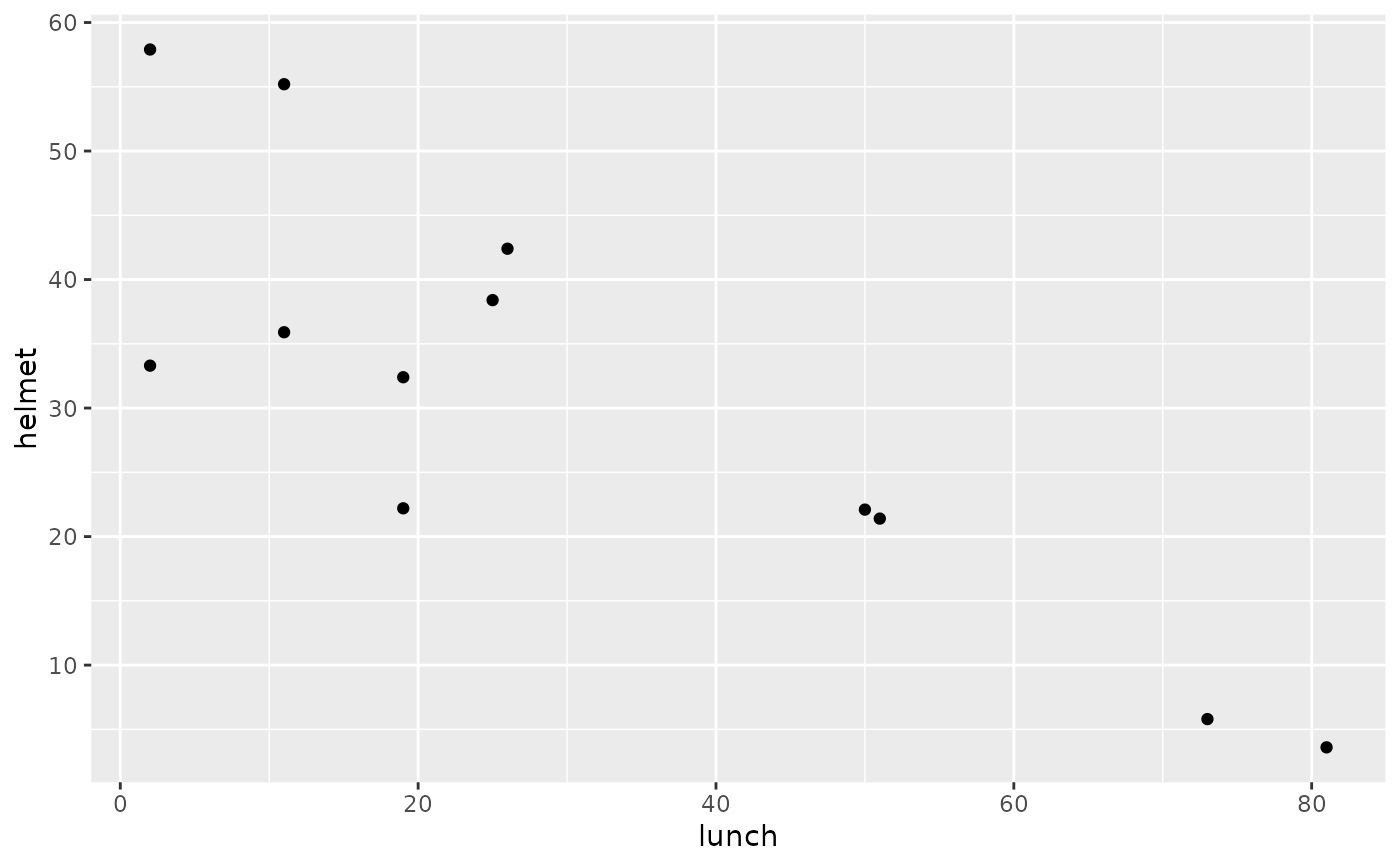
Examining the relationship between socioeconomic status measured as the percentage of children in a neighborhood receiving reduced-fee lunches at school (lunch) and the percentage of bike riders in the neighborhood wearing helmets (helmet).
Format
A data frame with 12 observations representing neighborhoods on the following 2 variables.
- lunch
Percent of students receiving reduced-fee school lunches.
- helmet
Percent of bike riders wearing helmets.
Examples
library(ggplot2)

ggplot(helmet, aes(x = lunch, y = helmet)) +
  geom_point()

