Grades on three exams and overall course grade for 233 students during several years for a statistics course at a university.
Format
A data frame with 233 observations, each representing a student.
- semester
Semester when grades were recorded.
- sex
Sex of the student as recorded on the university registration system: Man or Woman.
- exam1
Exam 1 grade.
- exam2
Exam 2 grade.
- exam3
Exam 3 grade.
- course_grade
Overall course grade.
Examples
library(ggplot2)
library(dplyr)

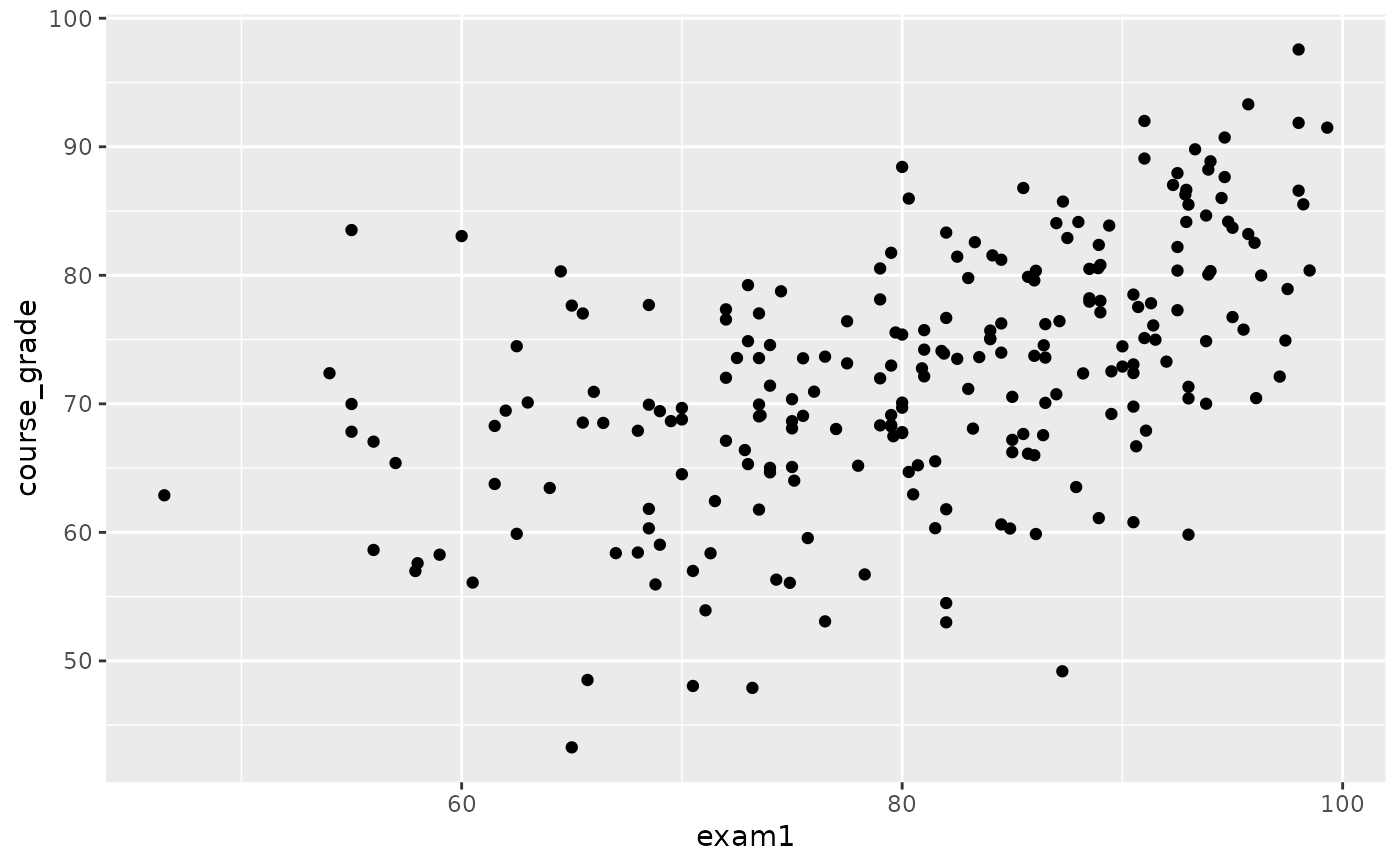
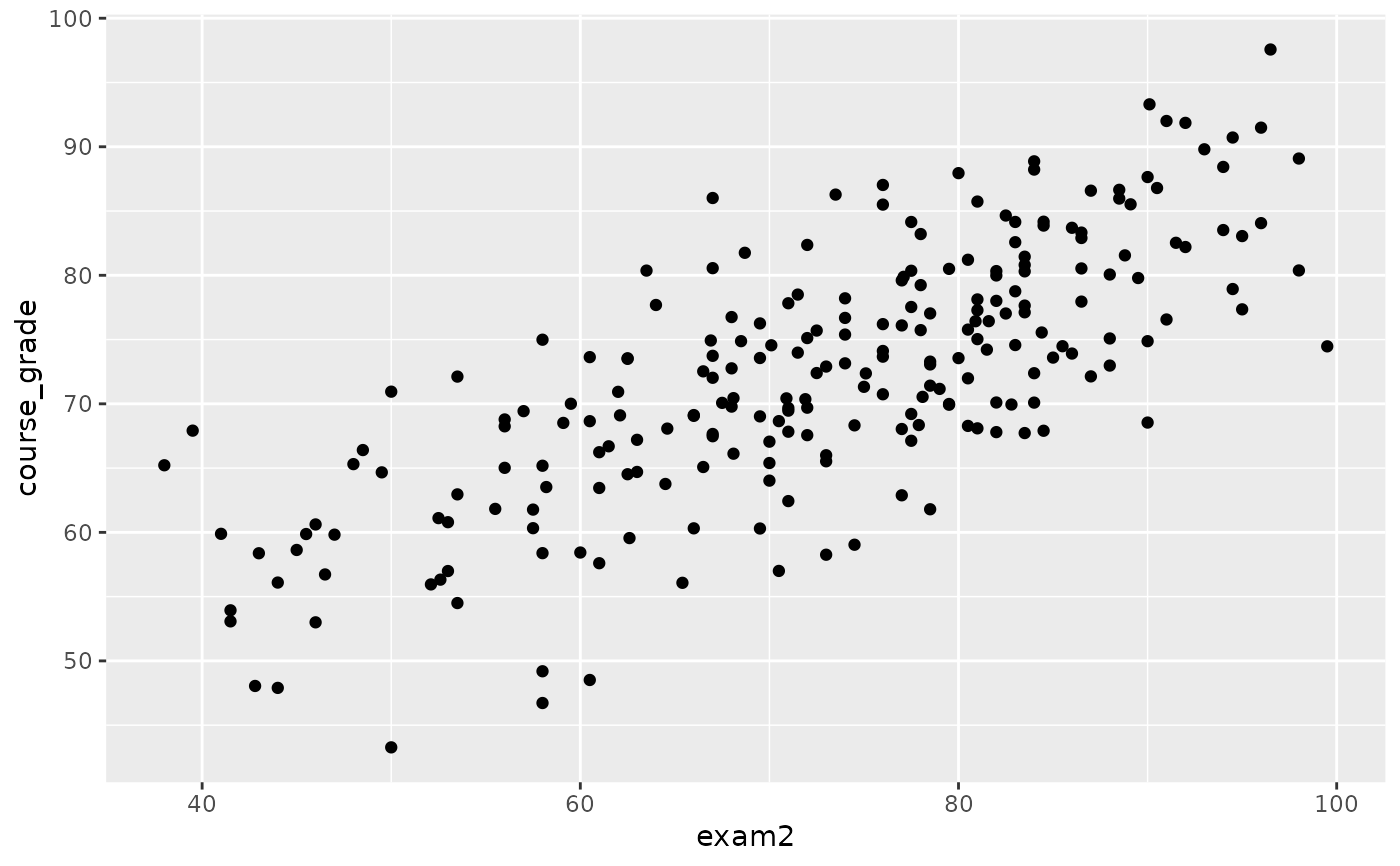
# Course grade vs. each exam
ggplot(exam_grades, aes(x = exam1, y = course_grade)) +
  geom_point()
#> Warning: Removed 1 row containing missing values or values outside the scale range
#> (`geom_point()`).


ggplot(exam_grades, aes(x = exam2, y = course_grade)) +
  geom_point()


ggplot(exam_grades, aes(x = exam2, y = course_grade)) +
  geom_point()


# Semester averages
exam_grades |>
  group_by(semester) |>
  summarise(across(exam1:course_grade, mean, na.rm = TRUE))
#> Warning: There was 1 warning in `summarise()`.
#> ℹ In argument: `across(exam1:course_grade, mean, na.rm = TRUE)`.
#> ℹ In group 1: `semester = "2000-1"`.
#> Caused by warning:
#> ! The `...` argument of `across()` is deprecated as of dplyr 1.1.0.
#> Supply arguments directly to `.fns` through an anonymous function instead.
#>
#>   # Previously
#>   across(a:b, mean, na.rm = TRUE)
#>
#>   # Now
#>   across(a:b, \(x) mean(x, na.rm = TRUE))
#> # A tibble: 6 × 5
#>   semester exam1 exam2 exam3 course_grade
#>   <chr>    <dbl> <dbl> <dbl>        <dbl>
#> 1 2000-1    73.8  76.2  76.8         72.3
#> 2 2000-2    75.5  71.2  68.0         70.6
#> 3 2001-1    87.0  75.1  78.1         76.7
#> 4 2001-2    82.9  67.5  67.2         69.0
#> 5 2002-1    82.1  76.3  84.9         72.3
#> 6 2003-1    85.7  67.8  77.1         72.3
