Details from the EPA.
Format
A data frame with 1108 observations on the following 28 variables.
- model_yr
a numeric vector
- mfr_name
Manufacturer name.
- division
Vehicle division.
- carline
Vehicle line.
- mfr_code
Manufacturer code.
- model_type_index
Model type index.
- engine_displacement
Engine displacement.
- no_cylinders
Number of cylinders.
- transmission_speed
Transmission speed.
- city_mpg
City mileage.
- hwy_mpg
Highway mileage.
- comb_mpg
Combined mileage.
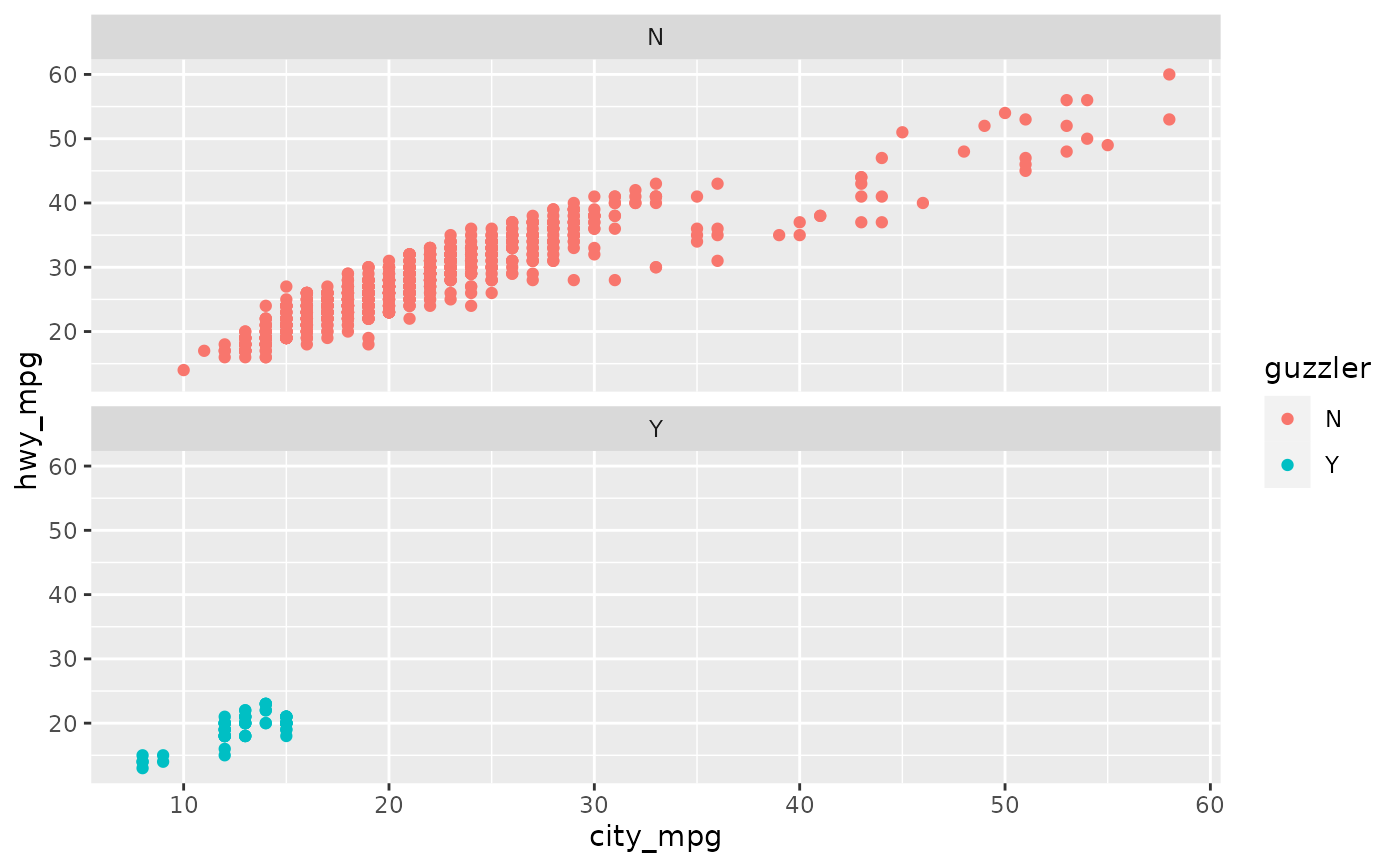
- guzzler
Whether the car is considered a "guzzler" or not, a factor with levels
NandY.- air_aspir_method
Air aspiration method.
- air_aspir_method_desc
Air aspiration method description.
- transmission
Transmission type.
- transmission_desc
Transmission type description.
- no_gears
Number of gears.
- trans_lockup
Whether transmission locks up, a factor with levels
NandY.- trans_creeper_gear
A factor with level
Nonly.- drive_sys
Drive system, a factor with levels.
- drive_desc
Drive system description.
- fuel_usage
Fuel usage, a factor with levels.
- fuel_usage_desc
Fuel usage description.
- class
Class of car.
- car_truck
Car or truck, a factor with levels
car,1,??,1.- release_date
Date of vehicle release.
- fuel_cell
Whether the car has a fuel cell or not, a factor with levels
N,NA.
Source
Fuel Economy Data from fueleconomy.gov. Retrieved 6 May, 2021.
Examples
library(ggplot2)
library(dplyr)

# Variable descriptions
distinct(epa2021, air_aspir_method_desc, air_aspir_method)
#> # A tibble: 5 × 2
#>   air_aspir_method_desc     air_aspir_method
#>   <fct>                     <fct>
#> 1 Turbocharged              TC
#> 2 Naturally Aspirated       NA
#> 3 Supercharged              SC
#> 4 Other                     OT
#> 5 Turbocharged+Supercharged TS
distinct(epa2021, transmission_desc, transmission)
#> # A tibble: 7 × 2
#>   transmission_desc                                                 transmission
#>   <fct>                                                             <fct>
#> 1 Automated Manual- Selectable (e.g. Automated Manual with paddles) AMS
#> 2 Manual                                                            M
#> 3 Semi-Automatic                                                    SA
#> 4 Automated Manual                                                  AM
#> 5 Continuously Variable                                             CVT
#> 6 Automatic                                                         A
#> 7 Selectable Continuously Variable (e.g. CVT with paddles)          SCV
distinct(epa2021, drive_desc, drive_sys)
#> # A tibble: 5 × 2
#>   drive_desc              drive_sys
#>   <fct>                   <fct>
#> 1 All Wheel Drive         A
#> 2 2-Wheel Drive, Rear     R
#> 3 2-Wheel Drive, Front    F
#> 4 4-Wheel Drive           4
#> 5 Part-time 4-Wheel Drive P
distinct(epa2021, fuel_usage_desc, fuel_usage)
#> # A tibble: 6 × 2
#>   fuel_usage_desc                            fuel_usage
#>   <fct>                                      <fct>
#> 1 Gasoline (Premium Unleaded Required)       GPR
#> 2 Gasoline (Premium Unleaded Recommended)    GP
#> 3 Gasoline (Regular Unleaded Recommended)    G
#> 4 Gasoline (Mid Grade Unleaded Recommended)  GM
#> 5 Diesel, ultra low sulfur (15 ppm, maximum) DU
#> 6 Diesel, low sulfur (500 ppm)               D

# Guzzlers and their mileages
ggplot(epa2021, aes(x = city_mpg, y = hwy_mpg, color = guzzler)) +
  geom_point() +
  facet_wrap(~guzzler, ncol = 1)


# Compare to 2012
epa2021 |>
  bind_rows(epa2012) |>
  group_by(model_yr) |>
  summarise(
    mean_city = mean(city_mpg),
    mean_hwy  = mean(hwy_mpg)
  )
#> # A tibble: 2 × 3
#>   model_yr mean_city mean_hwy
#>      <dbl>     <dbl>    <dbl>
#> 1     2012      19.4     26.4
#> 2     2021      20.9     27.3
