A random sample of 50 students gift aid for students at Elmhurst College.
Format
A data frame with 50 observations on the following 3 variables.
- family_income
Family income of the student.
- gift_aid
Gift aid, in $1000s.
- price_paid
Price paid by the student (tuition - gift aid).
Source
These data were sampled from a table of data for all freshman from the 2011 class at Elmhurst College that accompanied an article titled What Students Really Pay to Go to College published online by The Chronicle of Higher Education: https://www.chronicle.com/article/what-students-really-pay-to-go-to-college/?sra=true.
Examples
library(ggplot2)
library(broom)
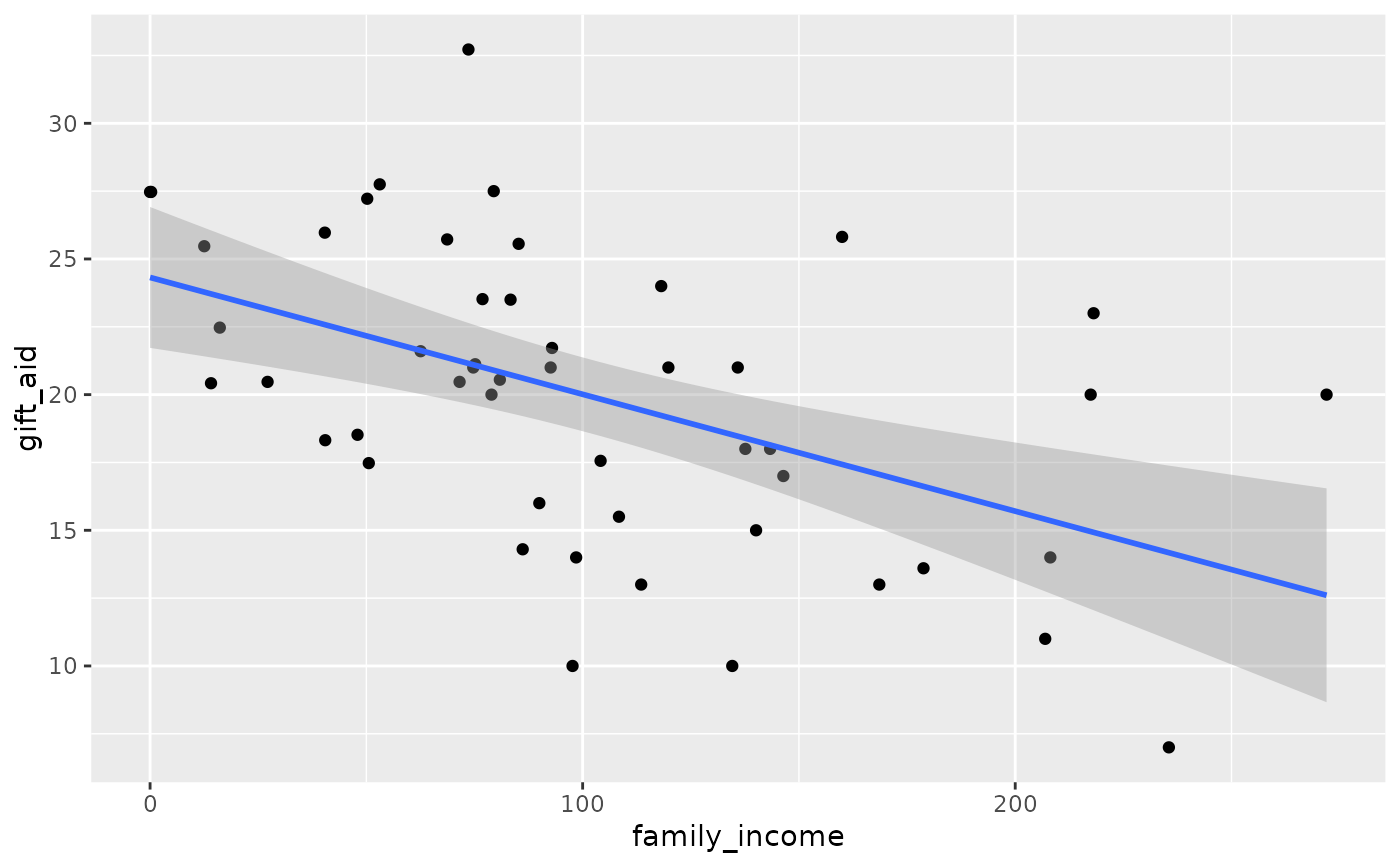
ggplot(elmhurst, aes(x = family_income, y = gift_aid)) +
geom_point() +
geom_smooth(method = "lm")
#> `geom_smooth()` using formula = 'y ~ x'
 mod <- lm(gift_aid ~ family_income, data = elmhurst)
tidy(mod)
#> # A tibble: 2 × 5
#> term estimate std.error statistic p.value
#> <chr> <dbl> <dbl> <dbl> <dbl>
#> 1 (Intercept) 24.3 1.29 18.8 8.28e-24
#> 2 family_income -0.0431 0.0108 -3.98 2.29e- 4
mod <- lm(gift_aid ~ family_income, data = elmhurst)
tidy(mod)
#> # A tibble: 2 × 5
#> term estimate std.error statistic p.value
#> <chr> <dbl> <dbl> <dbl> <dbl>
#> 1 (Intercept) 24.3 1.29 18.8 8.28e-24
#> 2 family_income -0.0431 0.0108 -3.98 2.29e- 4