Data on houses that were recently sold in the Duke Forest neighborhood of Durham, NC in November 2020.
Format
A data frame with 98 rows and 13 variables.
- address
Address of house.
- price
Sale price, in USD.
- bed
Number of bedrooms.
- bath
Number of bathrooms.
- area
Area of home, in square feet.
- type
Type of home (all are Single Family).
- year_built
Year the home was built.
- heating
Heating sytem.
- cooling
Cooling system (
otherorcentral).- parking
Type of parking available and number of parking spaces.
- lot
Area of the entire property, in acres.
- hoa
If the home belongs to an Home Owners Association, the associted fee (
NAotherwise).- url
URL of the listing.
Examples
library(ggplot2)

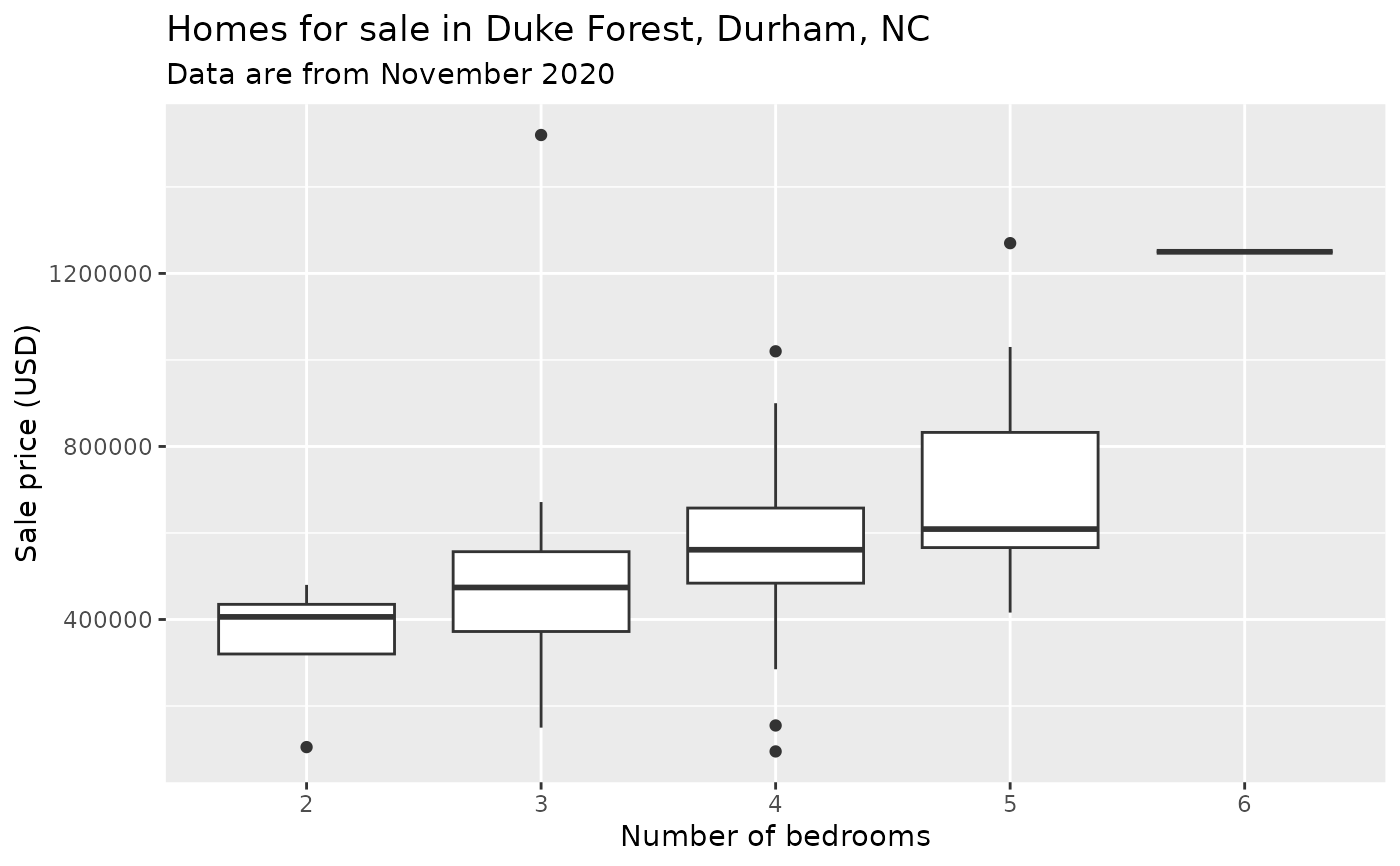
# Number of bedrooms and price
ggplot(duke_forest, aes(x = as.factor(bed), y = price)) +
  geom_boxplot() +
  labs(
    x = "Number of bedrooms",
    y = "Sale price (USD)",
    title = "Homes for sale in Duke Forest, Durham, NC",
    subtitle = "Data are from November 2020"
  )


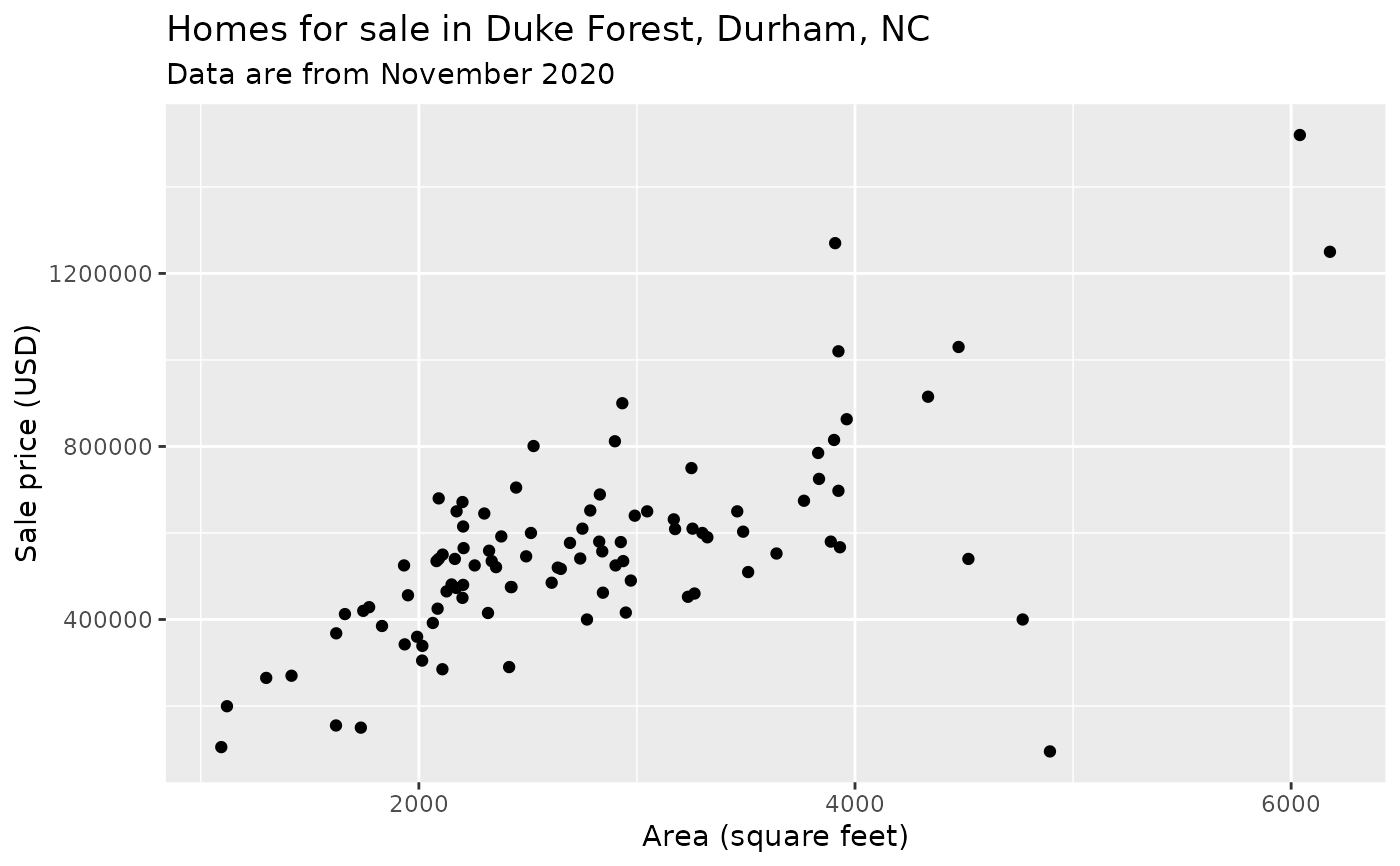
# Area and price
ggplot(duke_forest, aes(x = area, y = price)) +
  geom_point() +
  labs(
    x = "Area (square feet)",
    y = "Sale price (USD)",
    title = "Homes for sale in Duke Forest, Durham, NC",
    subtitle = "Data are from November 2020"
  )

