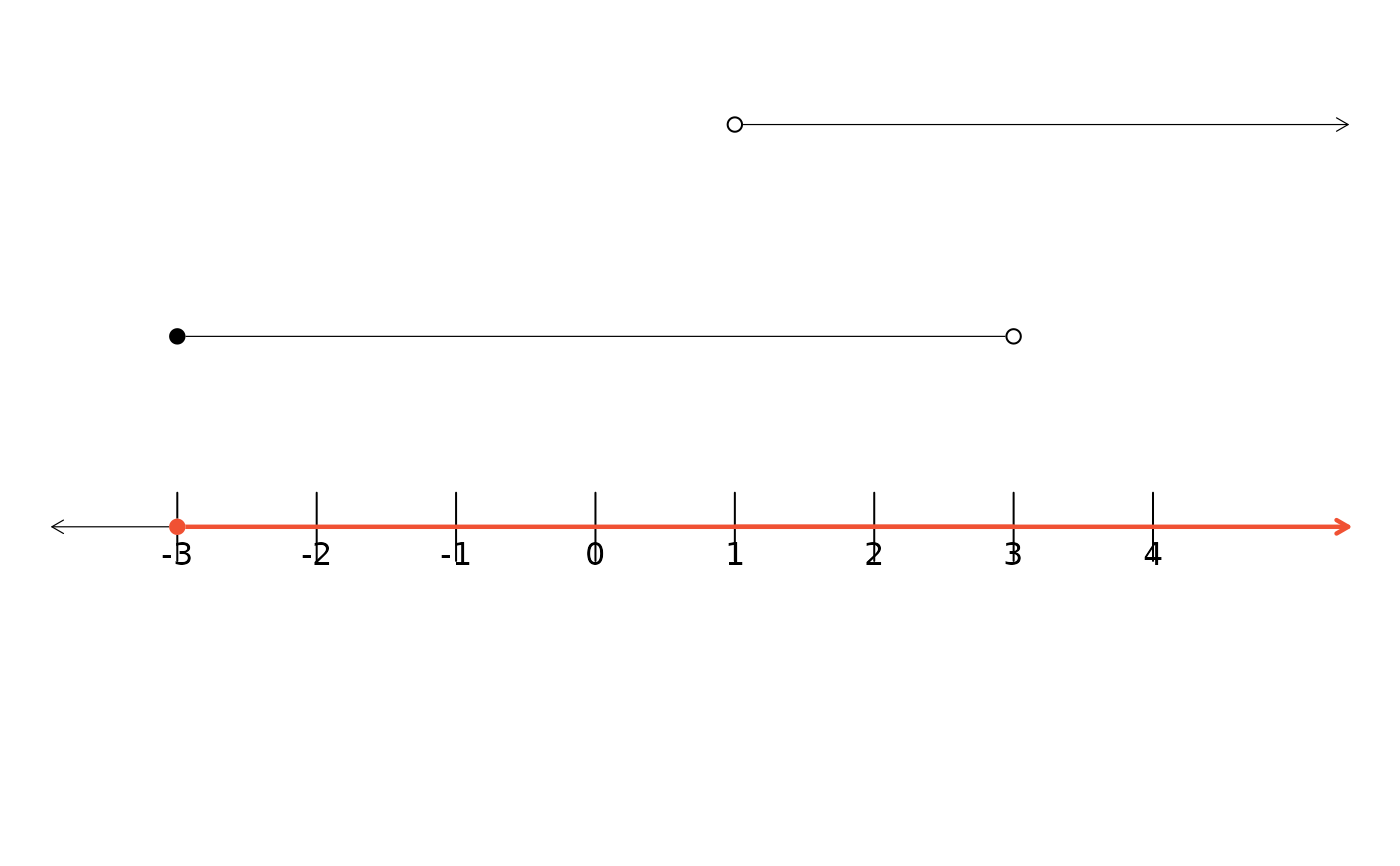
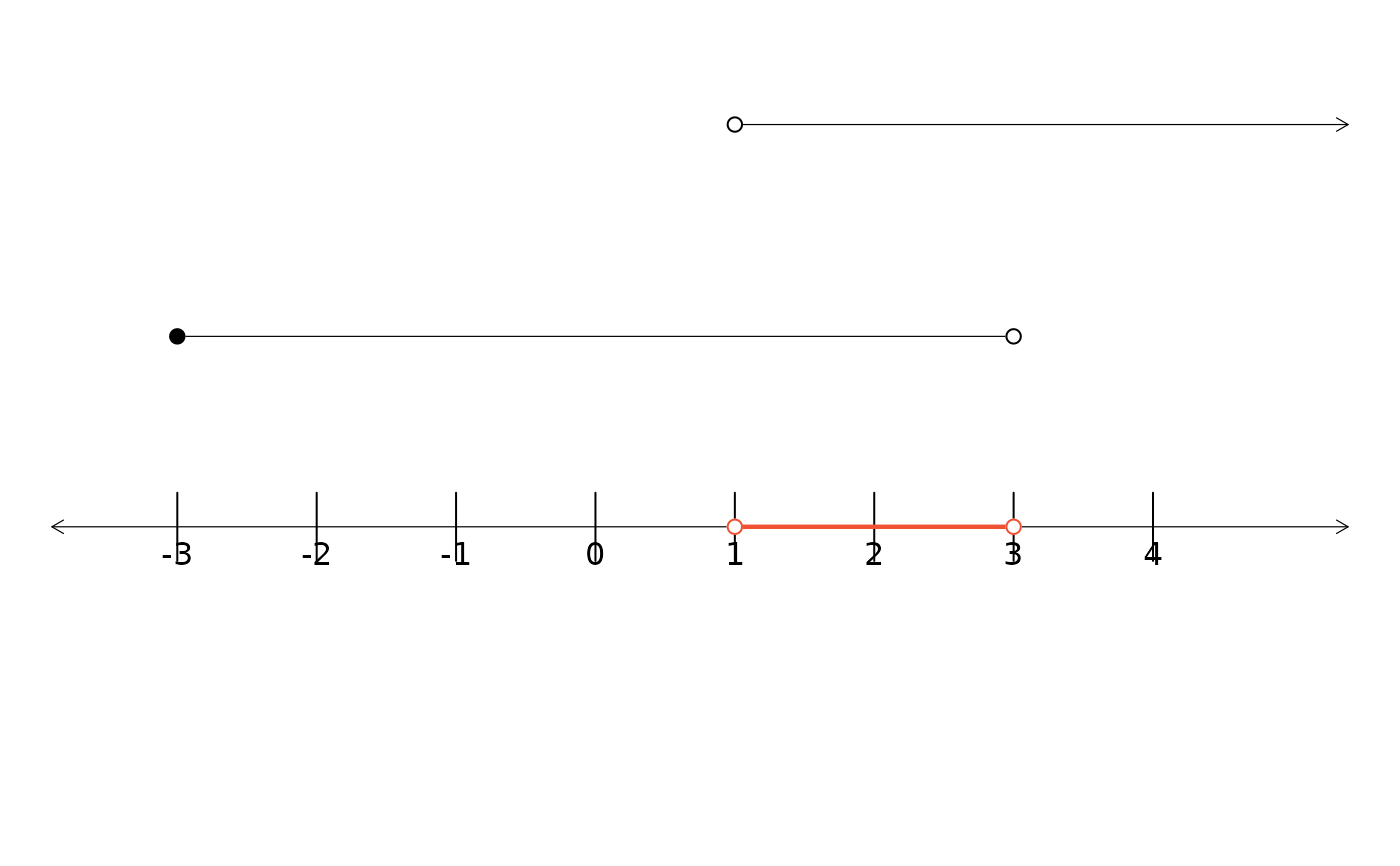
Creae a plot showing two line segments. The union or intersection of those
line segments can also be generated by utilizing the type argument.
Arguments
- x1
The endpoints of the first interval. Values larger (smaller) than 999 (-999) will be interpreted as (negative) infinity.
- x2
The endpoints of the second interval. Values larger (smaller) than 999 (-999) will be interpreted as (negative) infinity.
- l
A vector of length 2, where the values correspond to the left end point of each interval. A value of
"o"indicates the interval is open at the left and"c"indicates the interval is closed at this end.- r
A vector of length 2, where the values correspond to the right end point of each interval. A value of
"o"indicates the interval is open at the right and"c"indicates the interval is closed at this end.- type
By default, no intersection or union of the two lines will be shown (value of
"n"). To show the union of the line segments, specify"u". To indicate that the intersection be shown, specify"i".- COL
If the union or intersection is to be shown (see the
typeargument), then this parameter controls the color that will be shown.- lwd
If the union or intersection is to be shown (see the
typeargument), then this parameter controls the width of any corresponding lines or open points in the union or intersection.- ylim
A vector of length 2 specifying the vertical plotting limits, which may be useful for fine-tuning plots. The default is
c(-0.35,2).- mar
A vector of length 4 that represent the plotting margins.
- hideOrig
An optional argument that to specify that the two line segments should be shown (
hideOrigtakes valueFALSE, the default) or that they should be hidden (hideOrigtakes valueTRUE.


