Data on computer processors released between 2010 and 2020.
Format
A data frame with 875 rows and 12 variables.
- company
Manufacturer of the CPU.
- name
Model name of the processor.
- codename
Name given by manufacturer to all chips with this architecture.
- cores
Number of compute cores per processor.
- threads
The number of threads represents the number of simultaneous calculations that can be ongoing in the processor.
- base_clock
Base speed for the CPU in GHz.
- boost_clock
Single-core max speed for the CPU in GHz.
- socket
Specifies the type of connection to the motherboard.
- process
Size of the process node used in production in nm.
- l3_cache
Size of the level 3 cache on the processor in MB.
- tdp
Total draw power of the processor.
- released
Date which the processor was released to the public.
Examples
library(ggplot2)

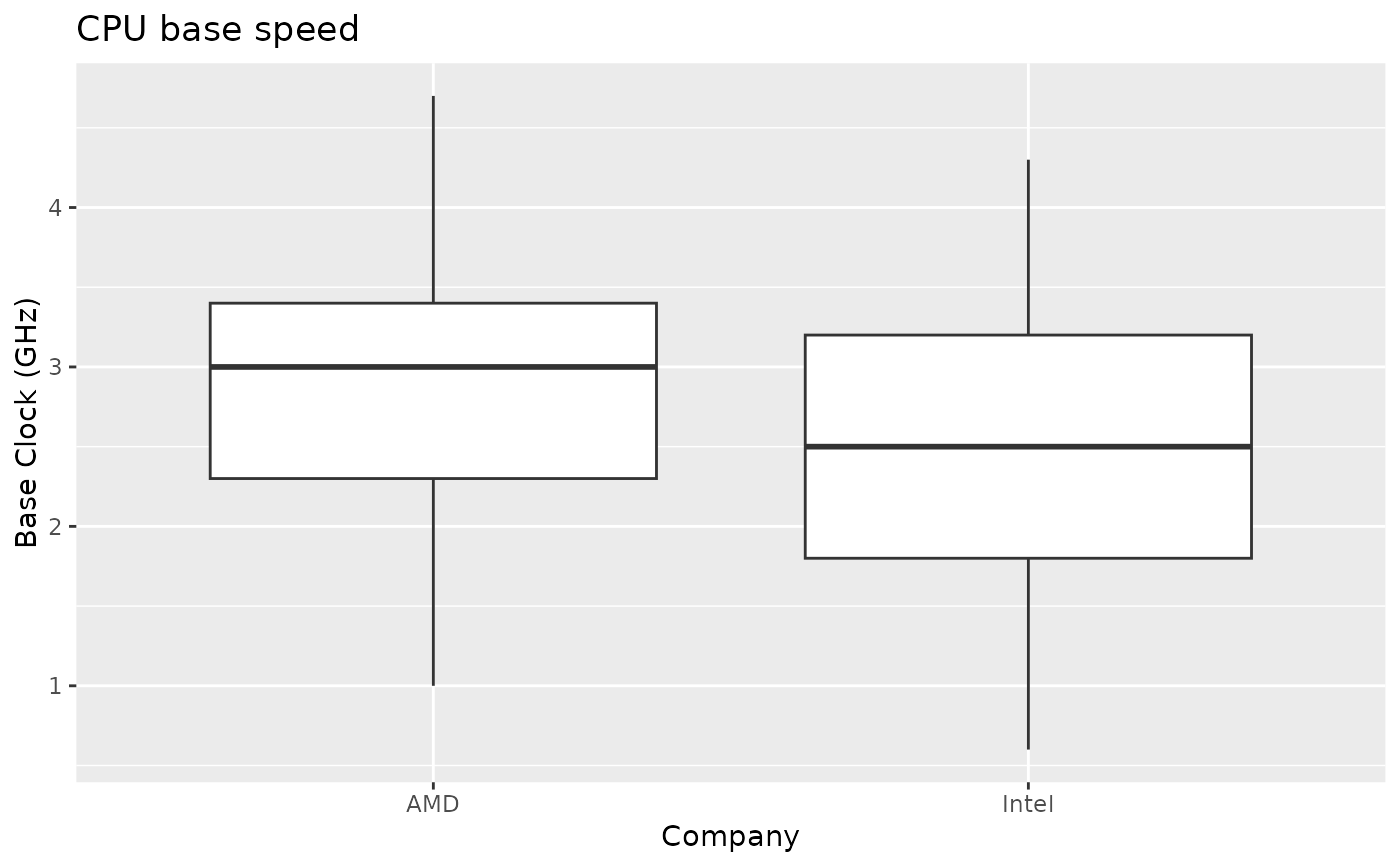
# CPU base speed
ggplot(cpu, aes(x = company, y = base_clock)) +
  geom_boxplot() +
  labs(
    x = "Company",
    y = "Base Clock (GHz)",
    title = "CPU base speed"
  )


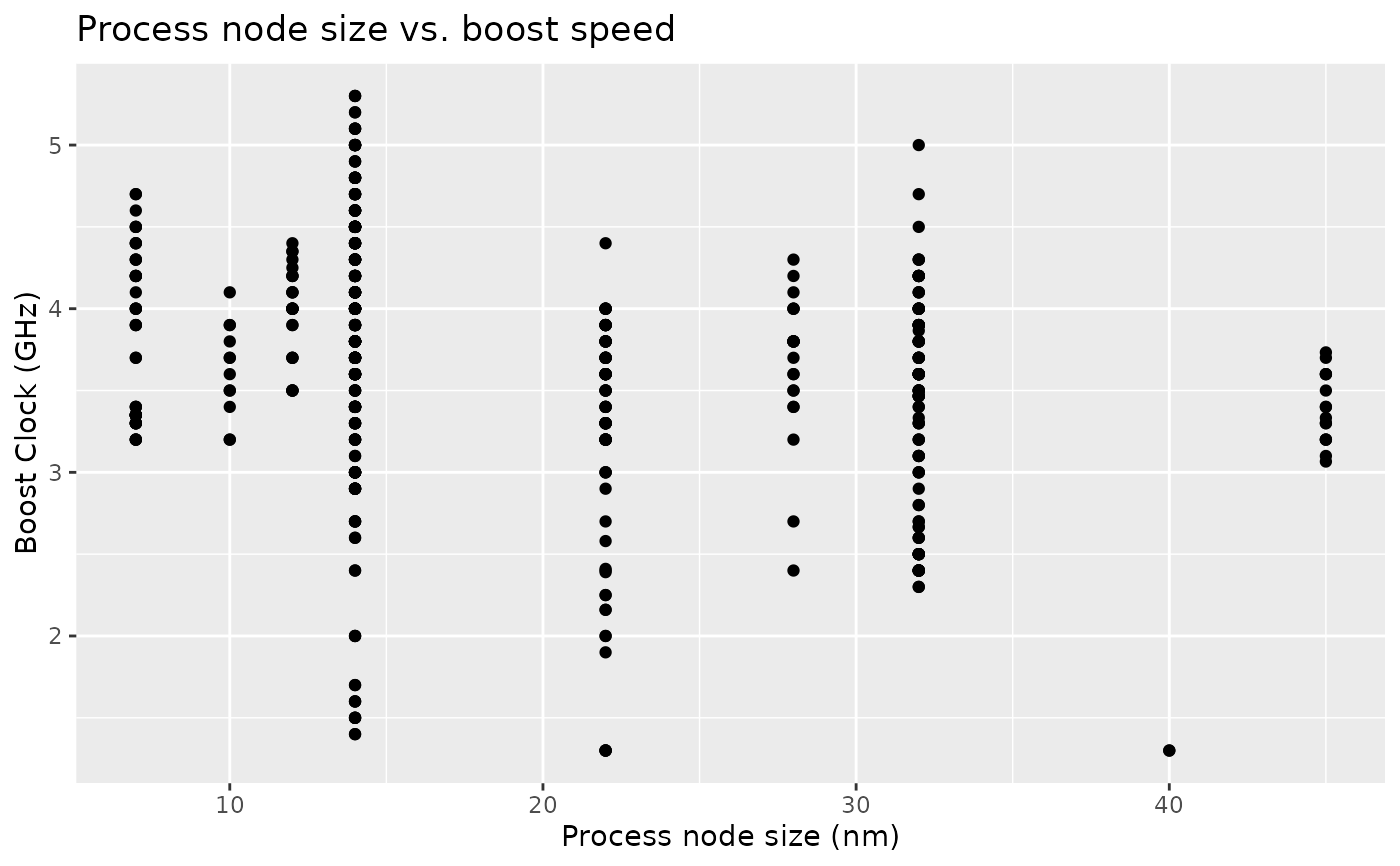
# Process node size vs. boost speed
ggplot(cpu, aes(x = process, y = boost_clock)) +
  geom_point() +
  labs(
    x = "Process node size (nm)",
    y = "Boost Clock (GHz)",
    title = "Process node size vs. boost speed"
  )
#> Warning: Removed 318 rows containing missing values or values outside the scale range
#> (`geom_point()`).

