Data on a sample of 500 people from the Cleveland, OH and Sacramento, CA metro areas.
Format
A data frame with 500 observations representing people on the following 8 variables.
- year
Year the data was collected.
- state
State where person resides.
- city
City.
- age
Age.
- sex
Sex.
- race
Race.
- marital_status
Marital status.
- personal_income
Personal income.
Examples
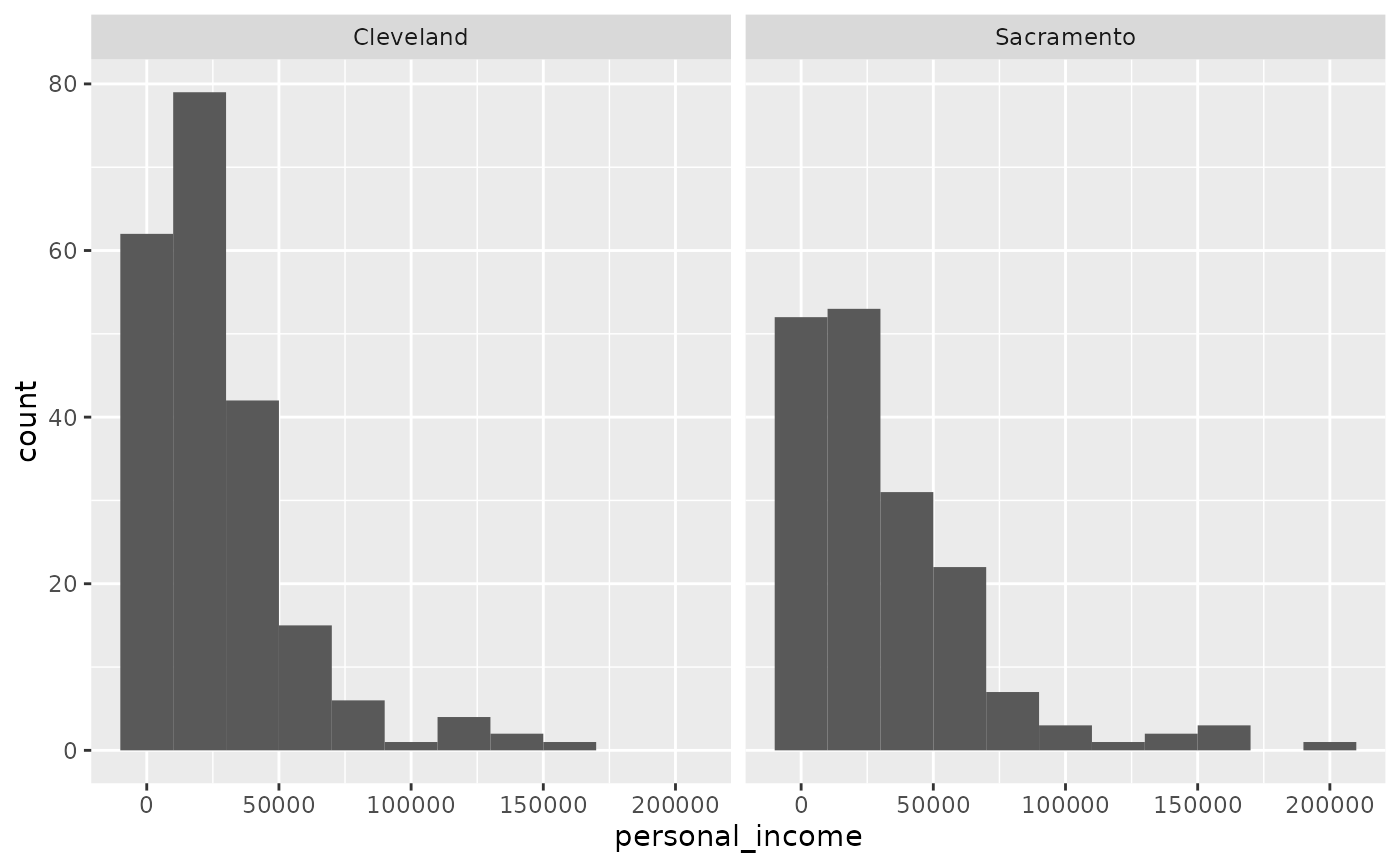
library(ggplot2)

ggplot(cle_sac, aes(x = personal_income)) +
  geom_histogram(binwidth = 20000) +
  facet_wrap(~city)
#> Warning: Removed 113 rows containing non-finite outside the scale range (`stat_bin()`).