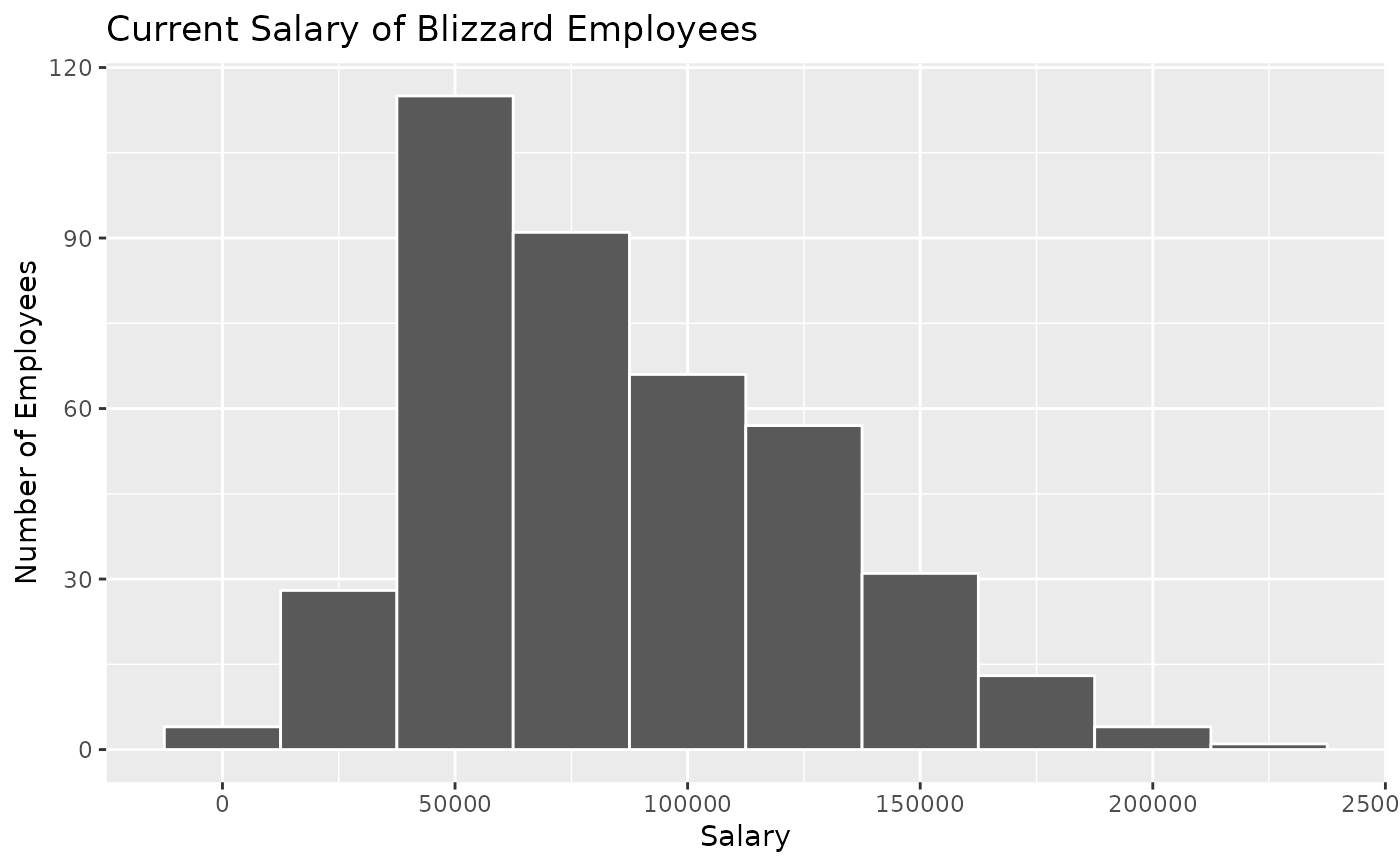
Employee generated anonymous survey of salary information.
Format
A data frame with 466 rows and 9 variables.
- timestamp
Time data was entered
- status
Specifies employment status.
- current_title
Current job title.
- current_salary
Current salary (in USD).
- salary_type
Frequency with levels year, hour, week.
- percent_incr
Raise given July 2020.
- other_info
Other information submitted by employee.
- location
Current office of employment.
- performance_rating
Most recent review performance rating.
Examples
library(ggplot2)
library(dplyr)

plot_data <- blizzard_salary |>
  mutate(annual_salary = case_when(
    salary_type == "week" ~ current_salary * 52,
    salary_type == "hour" ~ current_salary * 40 * 52,
    TRUE ~ current_salary
  ))

ggplot(plot_data, aes(annual_salary)) +
  geom_histogram(binwidth = 25000, color = "white") +
  labs(
    title = "Current Salary of Blizzard Employees",
    x = "Salary",
    y = "Number of Employees"
  )
#> Warning: Removed 56 rows containing non-finite outside the scale range (`stat_bin()`).

