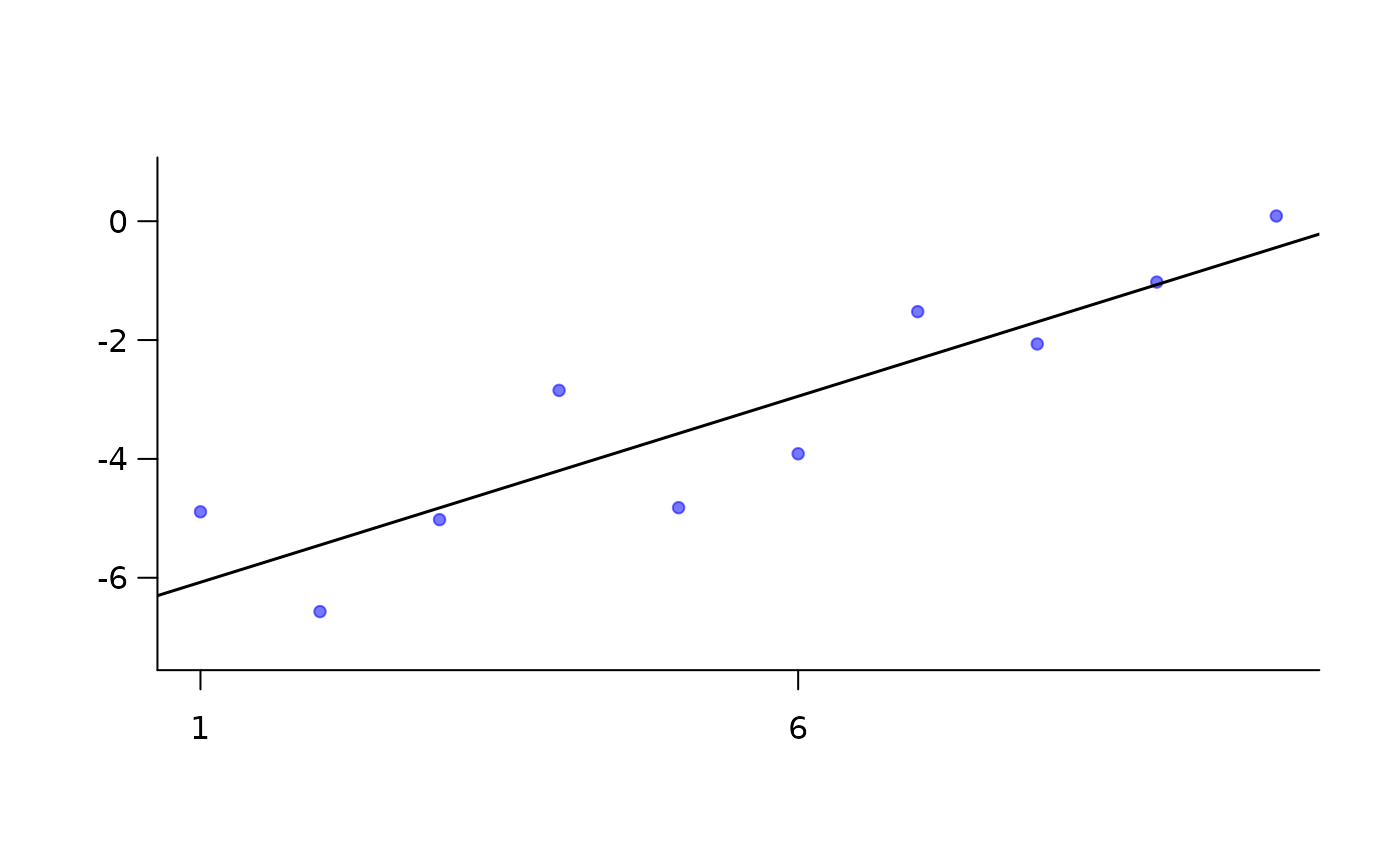
Plot data and add a regression line.
Usage
PlotWLine(
  x,
  y,
  xlab = "",
  ylab = "",
  col = fadeColor(4, "88"),
  cex = 1.2,
  pch = 20,
  n = 4,
  nMax = 4,
  yR = 0.1,
  axes = TRUE,
  ...
)
Arguments
- x
Predictor variable.
- y
Outcome variable.
- xlab
x-axis label.
- ylab
y-axis label.
- col
Color of points.
- cex
Size of points.
- pch
Plotting character.
- n
The preferred number of axis labels.
- nMax
The maximum number of axis labels.
- yR
y-limit buffer factor.
- axes
Boolean to indicate whether or not to include axes.
- ...
Passed to
plot.