Overlays a colored rectangle over the entire plotting region.
Usage
BG(col = openintro::COL[5, 9])Examples
Test <- function(col) {
plot(1:7,
col = COL[1:7], pch = 19, cex = 5,
xlim = c(0, 8),
ylim = c(0, 9)
)
BG(col)
points(2:8, col = COL[1:7], pch = 19, cex = 5)
text(2, 6, "Correct Color")
text(6, 2, "Affected Color")
}
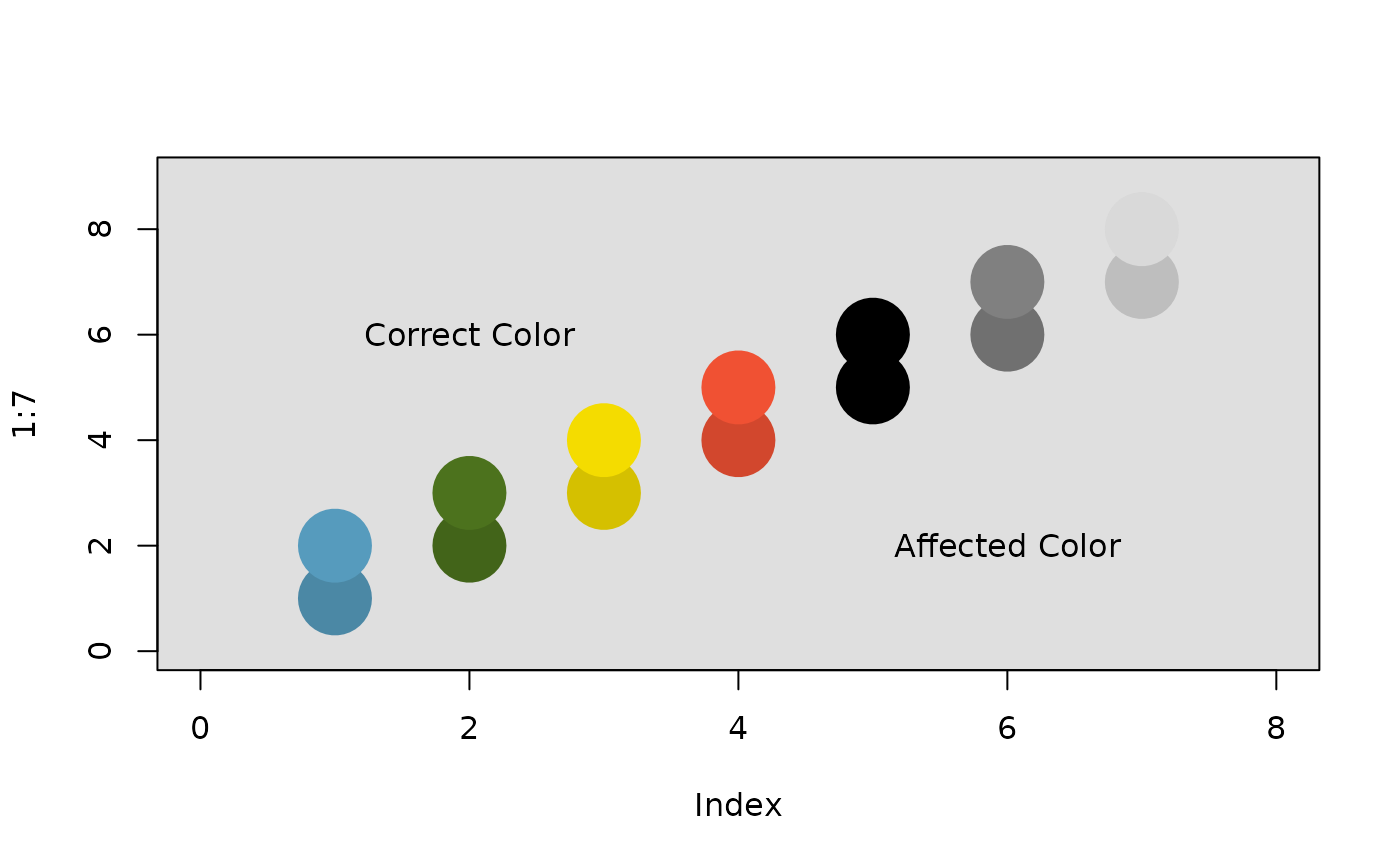
# Works well since black color almost fully transparent
Test(COL[5, 9])
 # Works less well since transparency isn't as significant
Test(COL[5, 6])
# Works less well since transparency isn't as significant
Test(COL[5, 6])
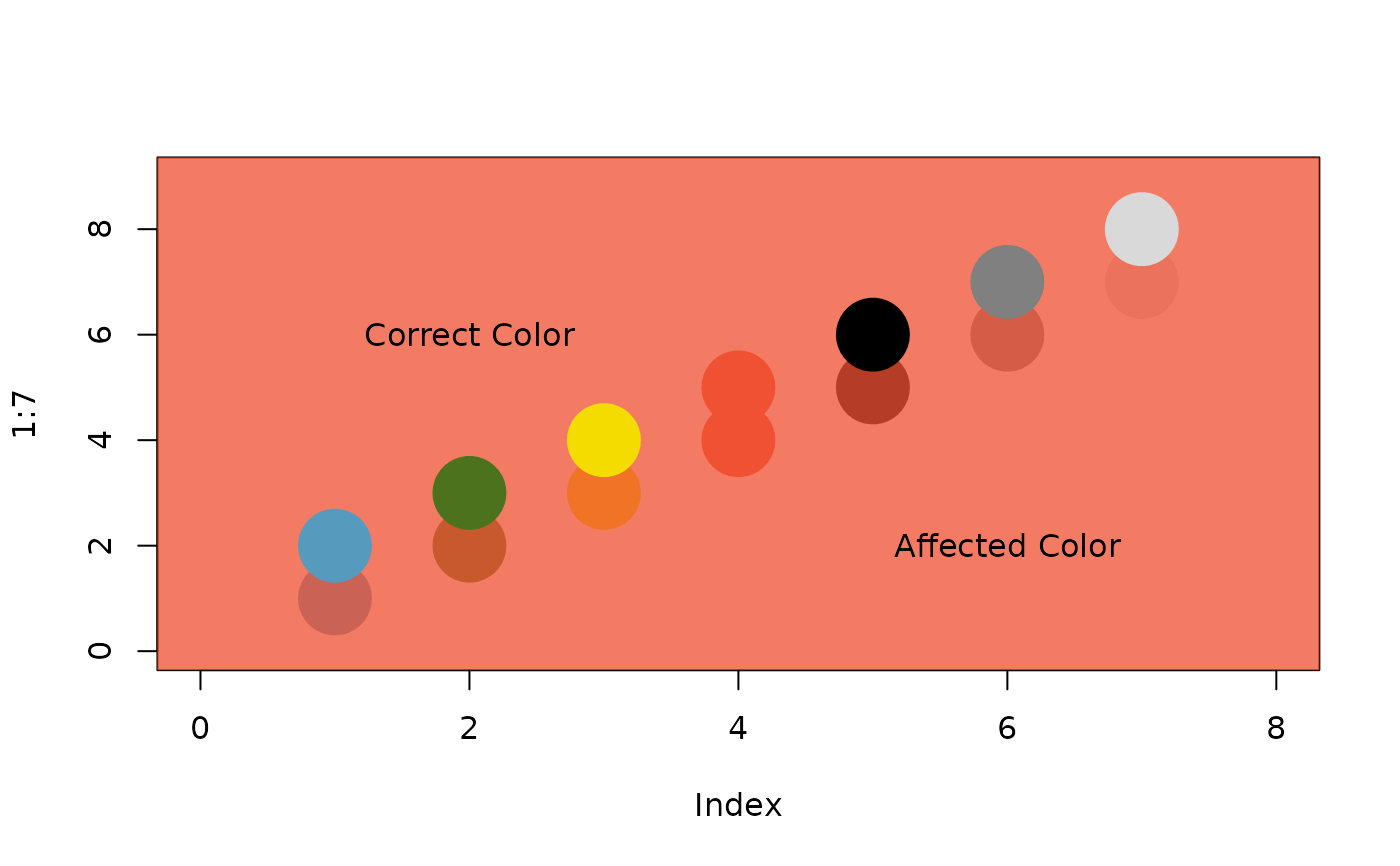
 # Pretty ugly due to overlay
Test(COL[5, 3])
# Pretty ugly due to overlay
Test(COL[5, 3])
 # Basically useless due to heavy color gradient
Test(COL[4, 2])
# Basically useless due to heavy color gradient
Test(COL[4, 2])