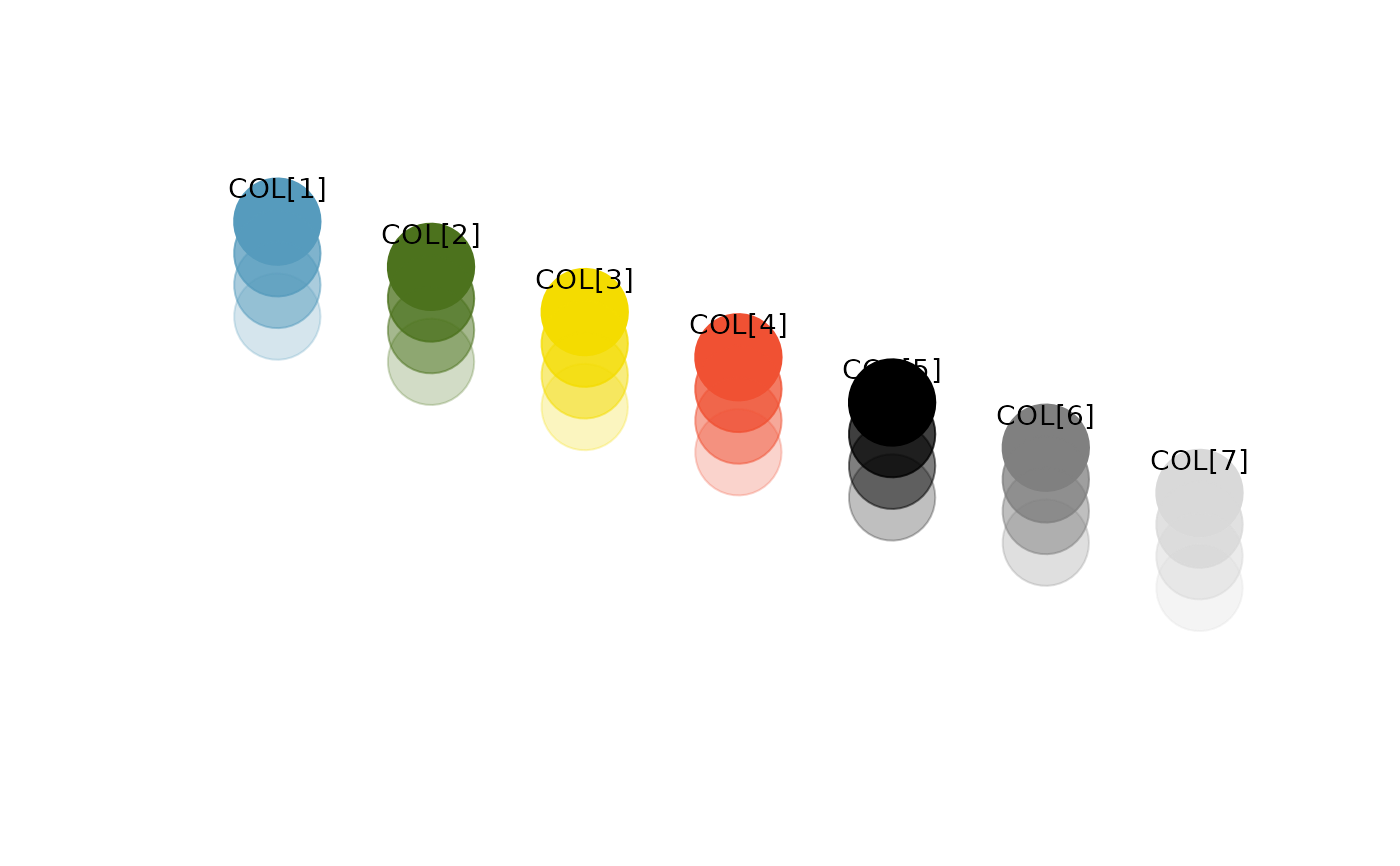
These are the core colors used for the OpenIntro Statistics textbook. The blue, green, yellow, and red colors are also gray-scaled, meaning no changes are required when printing black and white copies.
Format
A 7-by-13 matrix of 7 colors with thirteen fading scales: blue, green, yellow, red, black, gray, and light gray.
Source
Colors selected by OpenIntro's in-house graphic designer, Meenal Patel.
Examples
plot(1:7, 7:1,
  col = COL, pch = 19, cex = 6, xlab = "", ylab = "",
  xlim = c(0.5, 7.5), ylim = c(-2.5, 8), axes = FALSE
)
text(1:7, 7:1 + 0.7, paste("COL[", 1:7, "]", sep = ""), cex = 0.9)
points(1:7, 7:1 - 0.7, col = COL[, 2], pch = 19, cex = 6)
points(1:7, 7:1 - 1.4, col = COL[, 3], pch = 19, cex = 6)
points(1:7, 7:1 - 2.1, col = COL[, 4], pch = 19, cex = 6)