State-level data on federal elections held in November between 1980 and 2014.
Format
A data frame with 936 rows and 7 variables.
- year
Year election was held.
- region
Specifies if data is state or national total.
- voting_eligible_population
Number of citizens eligible to vote; does not count felons.
- total_ballots_counted
Number of ballots cast.
- highest_office
Number of ballots that contained a vote for the highest office of that election.
- percent_total_ballots_counted
Overall voter turnout percentage.
- percent_highest_office
Highest office voter turnout percentage.
Examples
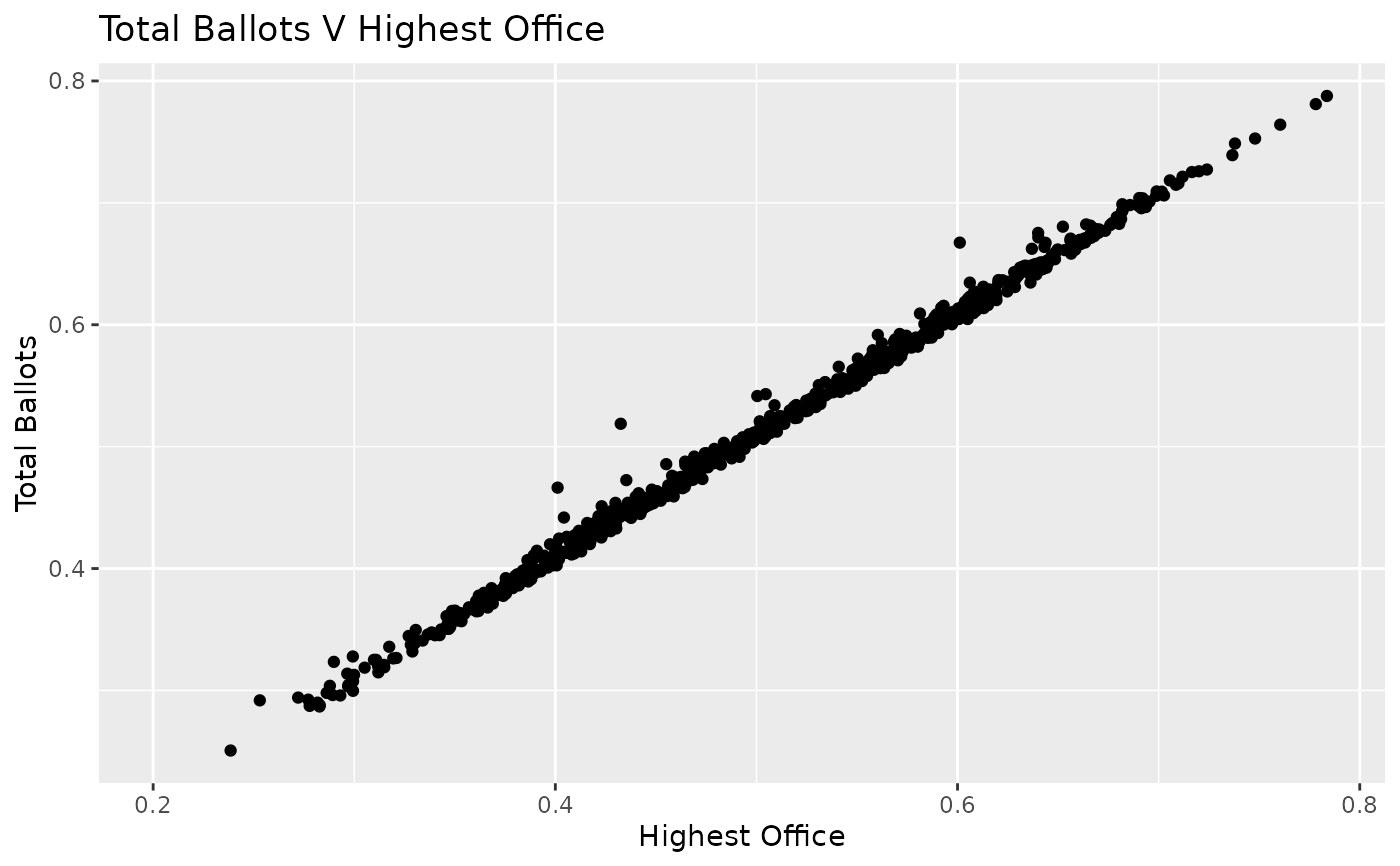
library(ggplot2)

ggplot(voter_count, aes(x = percent_highest_office, y = percent_total_ballots_counted)) +
  geom_point() +
  labs(
    title = "Total Ballots V Highest Office",
    x = "Highest Office",
    y = "Total Ballots"
  )
#> Warning: Removed 223 rows containing missing values or values outside the scale range
#> (`geom_point()`).