Average Time Spent on Activities by Americans
Format
A data frame with 11 rows and 8 variables.
- year
Year data collected
- household_activities
Average hours per day spent on household activities - travel included
- eating_and_drinking
Average hours per day spent eating and drinking including travel.
- leisure_and_sports
Average hours per day spent on leisure and sports - including travel.
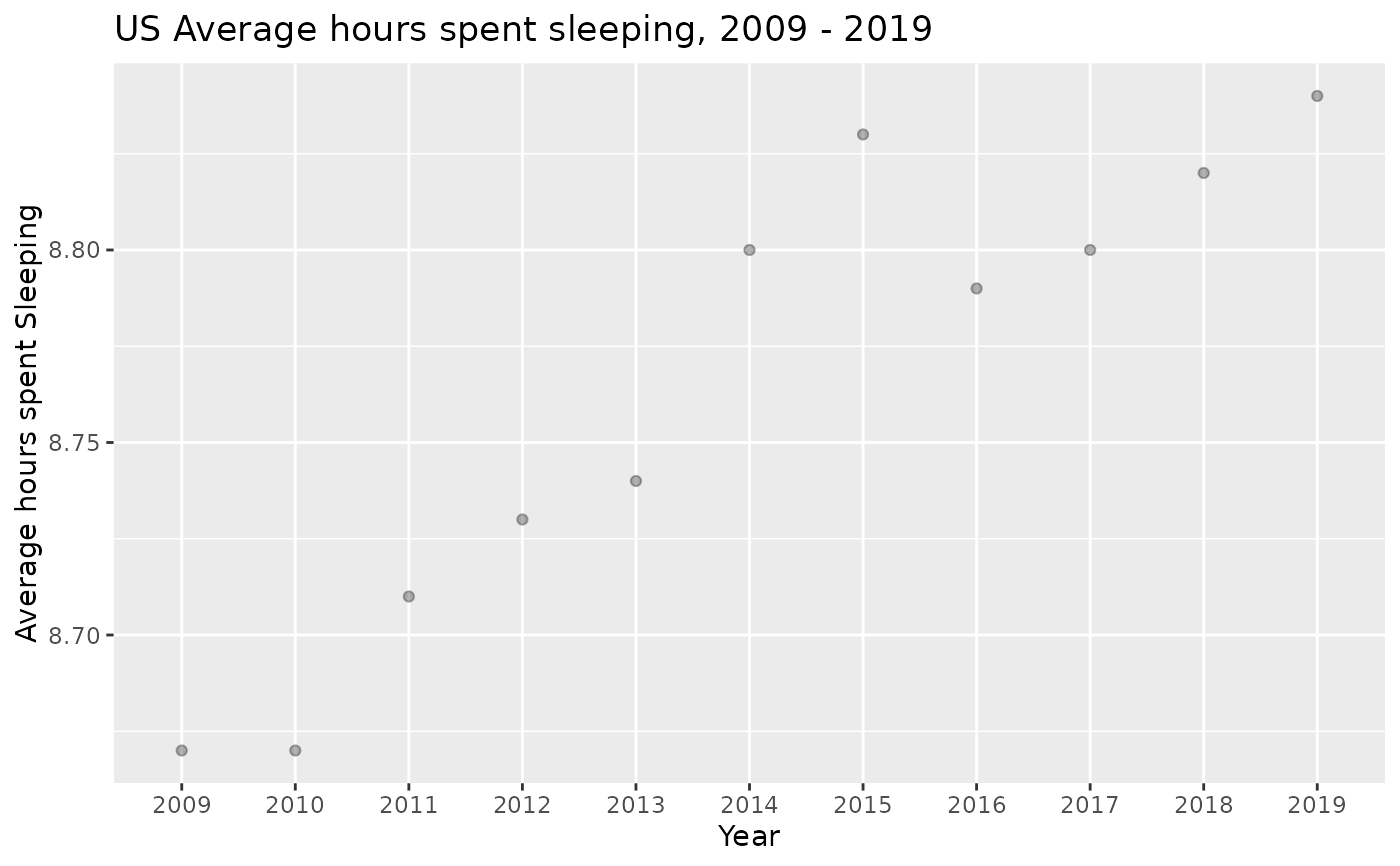
- sleeping
Average Hours spent sleeping.
- caring_children
Average hours spent per day caring for and helping children under 18 years of age.
- working_employed
Average hours spent working for those employed. (15 years and older)
- working_employed_days_worked
Average hours per day spent working on days worked (15 years and older)