National data on the number of crimes committed in the US between 1960 and 2019.
Format
A data frame with 60 rows and 12 variables.
- year
Year data was collected.
- population
Population of the United States the year data was collected.
- total
Total number of violent and property crimes committed.
- violent
Total number of violent crimes committed.
- property
Total number of property crimes committed.
- murder
Number of murders committed. Counted in violent total.
- forcible_rape
Number of forcible rapes committed. Counted in violent total.
- robbery
Number of robberies committed. Counted in violent total.
- aggravated_assault
Number of aggravated assaults committed. Counted in violent total.
- burglary
Number of burglaries committed. Counted in property total.
- larceny_theft
Number of larcency thefts committed. Counted in property total.
- vehicle_theft
Number of vehicle thefts committed. Counted in property total.
Examples
library(ggplot2)

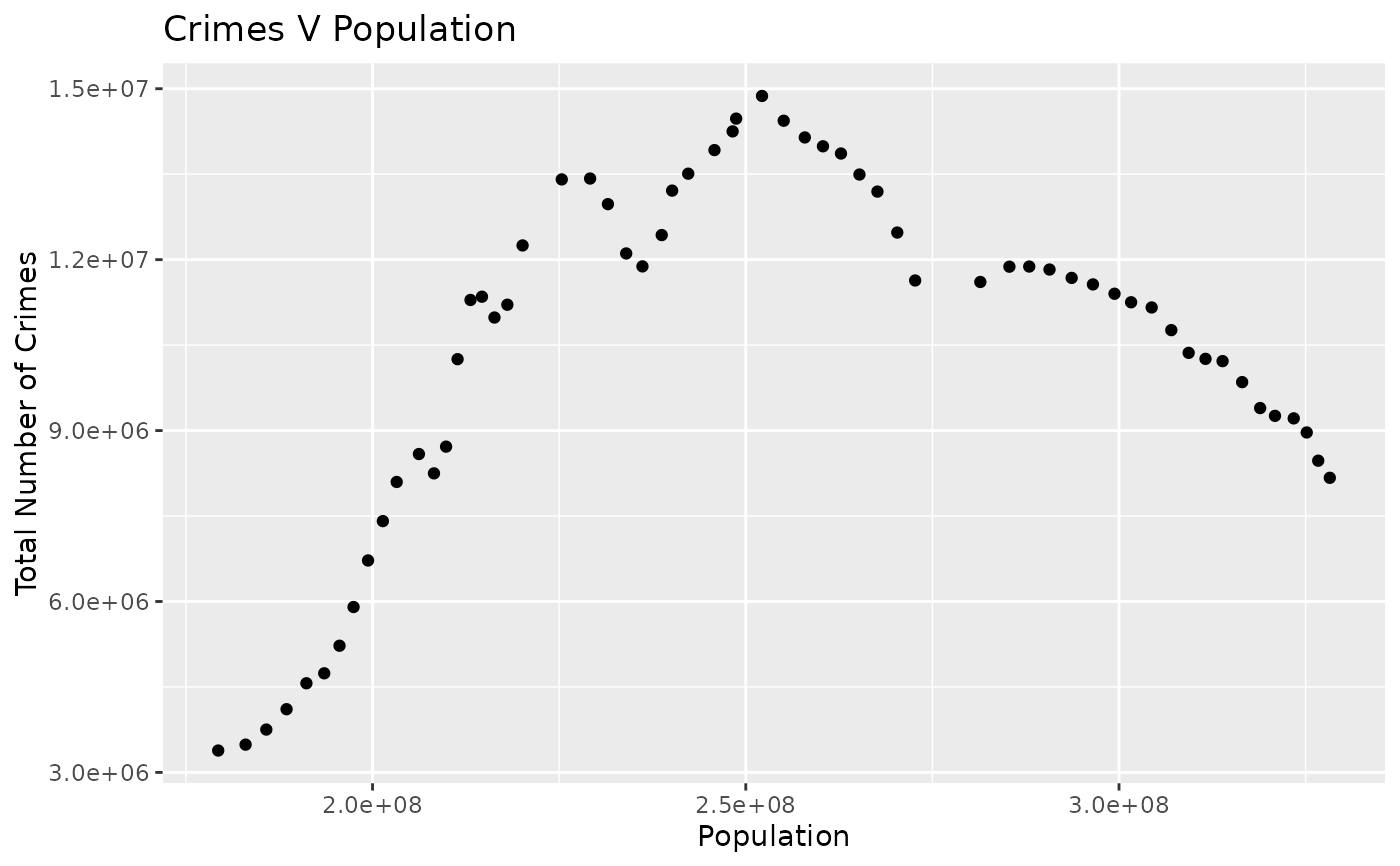
ggplot(us_crime_rates, aes(x = population, y = total)) +
  geom_point() +
  labs(
    title = "Crimes V Population",
    x = "Population",
    y = "Total Number of Crimes"
  )


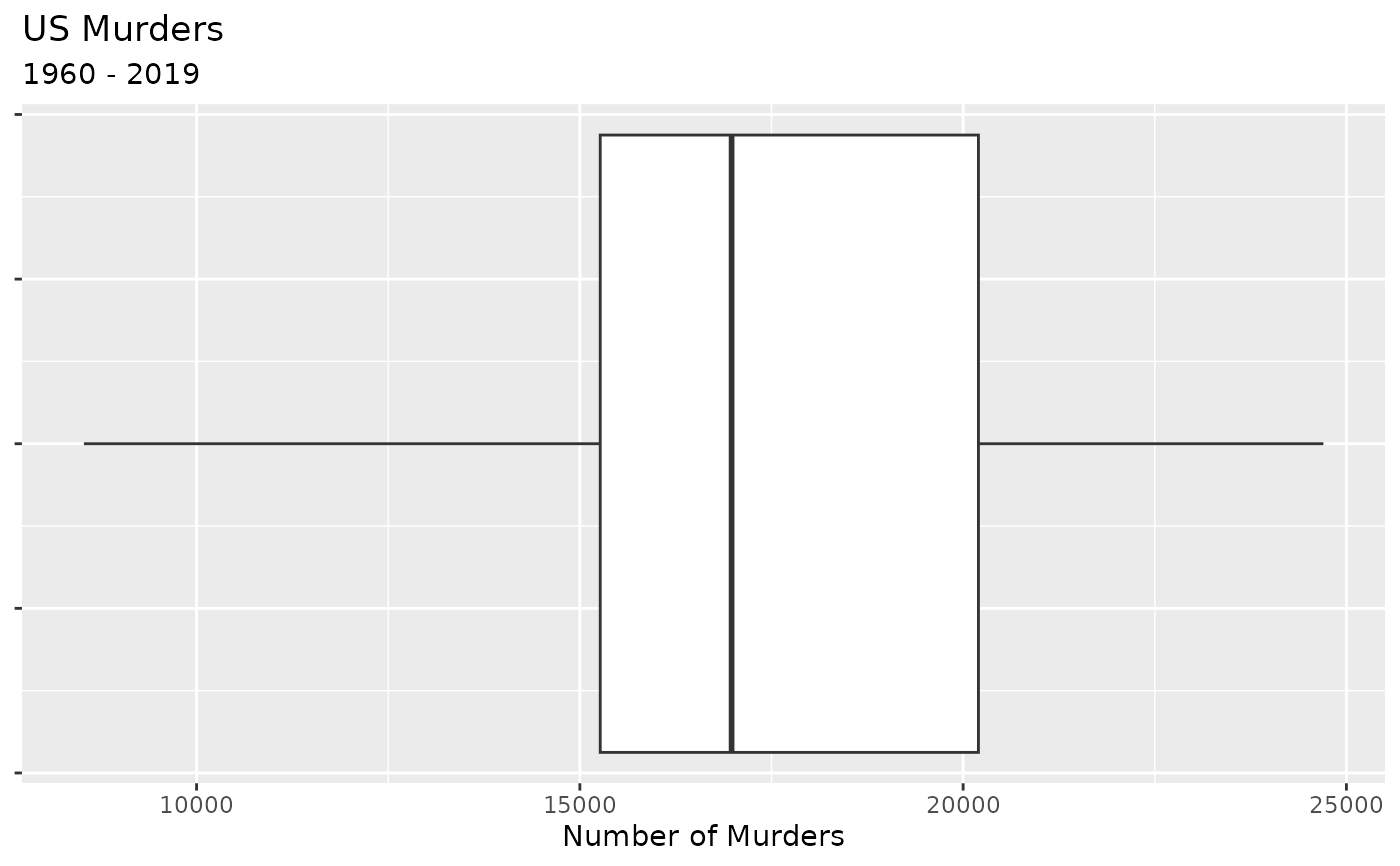
ggplot(us_crime_rates, aes(x = murder)) +
  geom_boxplot() +
  labs(
    title = "US Murders",
    subtitle = "1960 - 2019",
    x = "Number of Murders"
  ) +
  theme(axis.text.y = element_blank())

