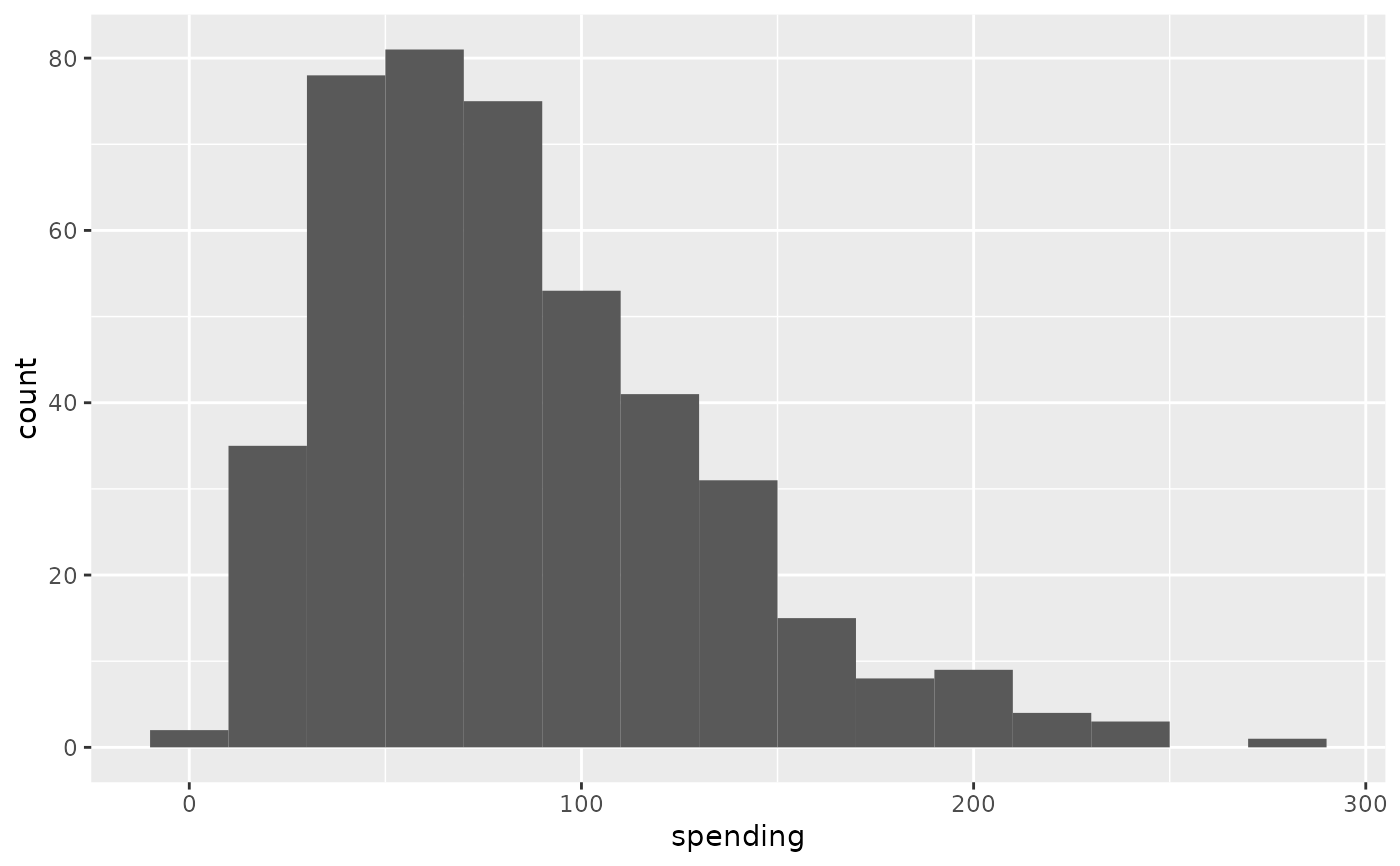
Thanksgiving spending, simulated based on Gallup poll.
Source:R/data-thanksgiving_spend.R
thanksgiving_spend.RdThis entry gives simulated spending data for Americans during Thanksgiving in 2009 based on findings of a Gallup poll.
Format
A data frame with 436 observations on the following 1 variable.
- spending
Amount of spending, in US dollars.
Examples
library(ggplot2)

ggplot(thanksgiving_spend, aes(x = spending)) +
  geom_histogram(binwidth = 20)