Best actor and actress Oscar winners from 1929 to 2018
Format
A data frame with 182 observations on the following 10 variables.
- oscar_no
Oscar ceremony number.
- oscar_yr
Year the Oscar ceremony was held.
- award
Best actressorBest actor.- name
Name of winning actor or actress.
- movie
Name of movie actor or actress got the Oscar for.
- age
Age at which the actor or actress won the Oscar.
- birth_pl
US State where the actor or actress was born, country if foreign.
- birth_date
Birth date of actor or actress.
- birth_mo
Birth month of actor or actress.
- birth_d
Birth day of actor or actress.
- birth_y
Birth year of actor or actress.
Source
Journal of Statistical Education, http://jse.amstat.org/datasets/oscars.dat.txt, updated through 2019 using information from Oscars.org and Wikipedia.org.
Details
Although there have been only 84 Oscar ceremonies until 2012, there are 85 male winners and 85 female winners because ties happened on two occasions (1933 for the best actor and 1969 for the best actress).
Examples
library(ggplot2)
library(dplyr)
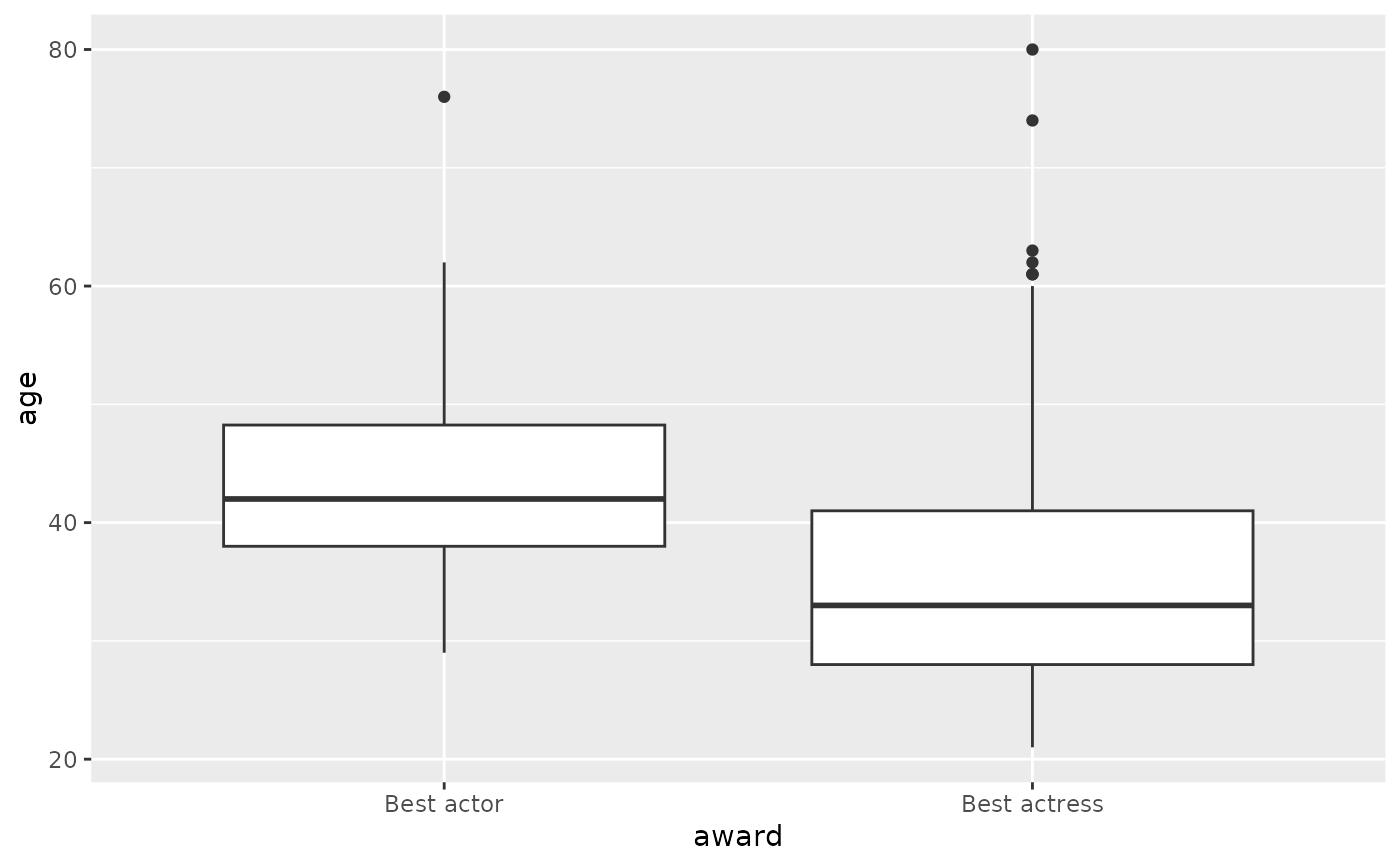
ggplot(oscars, aes(x = award, y = age)) +
geom_boxplot()
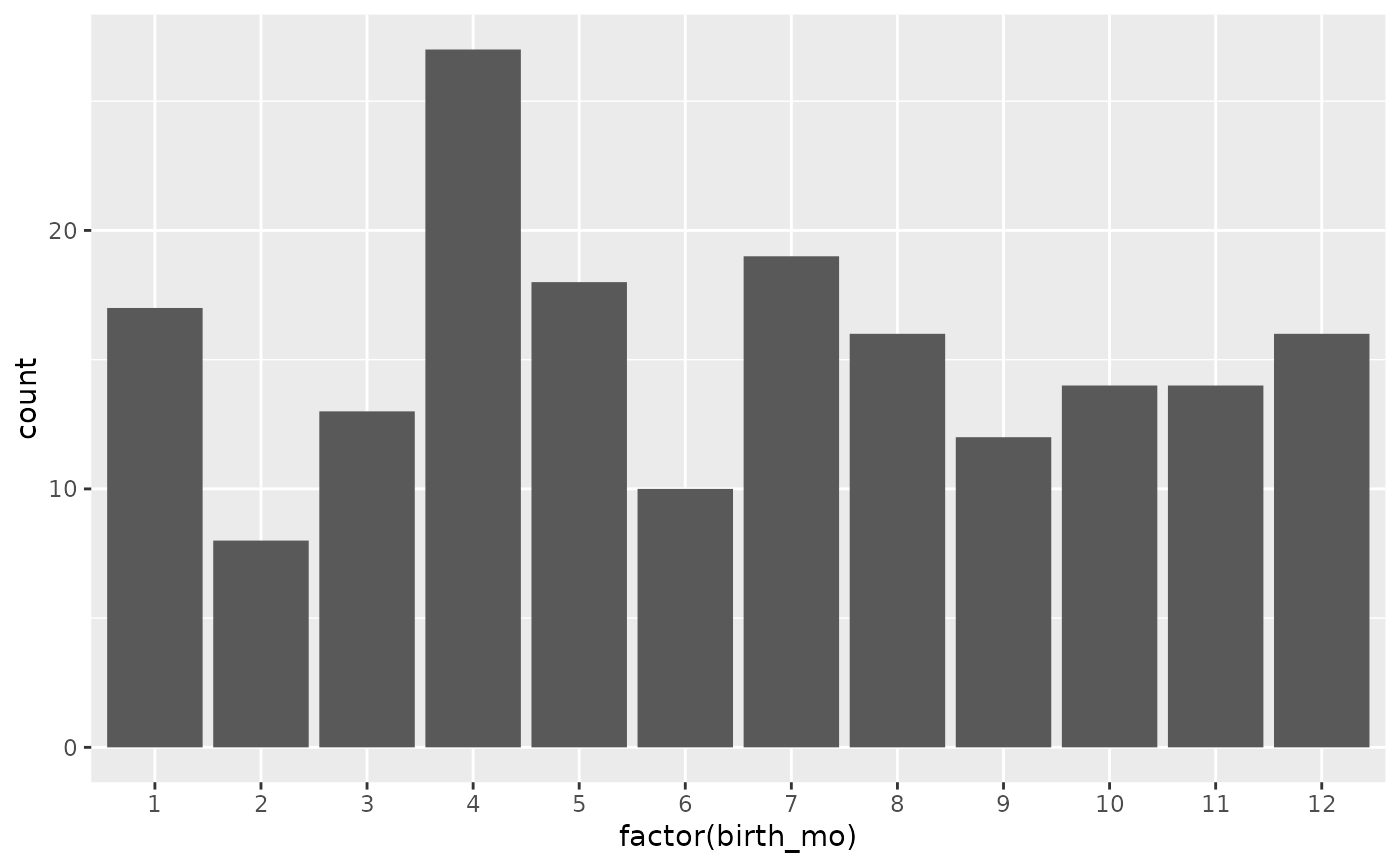
 ggplot(oscars, aes(x = factor(birth_mo))) +
geom_bar()
ggplot(oscars, aes(x = factor(birth_mo))) +
geom_bar()
 oscars |>
count(birth_pl, sort = TRUE)
#> # A tibble: 51 × 2
#> birth_pl n
#> <chr> <int>
#> 1 England 29
#> 2 California 25
#> 3 New York 23
#> 4 Connecticut 5
#> 5 Illinois 5
#> 6 Pennsylvania 5
#> 7 Massachusetts 4
#> 8 Missouri 4
#> 9 New Jersey 4
#> 10 Ohio 4
#> # ℹ 41 more rows
oscars |>
count(birth_pl, sort = TRUE)
#> # A tibble: 51 × 2
#> birth_pl n
#> <chr> <int>
#> 1 England 29
#> 2 California 25
#> 3 New York 23
#> 4 Connecticut 5
#> 5 Illinois 5
#> 6 Pennsylvania 5
#> 7 Massachusetts 4
#> 8 Missouri 4
#> 9 New Jersey 4
#> 10 Ohio 4
#> # ℹ 41 more rows