A dataset with individual team summaries for the NBA Finals series from 1950 to 2022. To win the Finals, a team must win 4 games. The maximum number of games in a series is 7.
Format
A data frame with 33 rows and 7 variables:
- team
Team name.
- win
Number of NBA Championships won.
- loss
Number of NBA Championships lost.
- apps
Number of NBA Finals appearances.
- pct
Win percentage.
- years_won
Years in which the team won a Championship.
- years_lost
Years in which the team lost a Championship.
Details
Notes:
The Chicago Stags folded in 1950, the Washington Capitols in 1951 and the Baltimore Bullets in 1954.
This list uses current team names. For example, the Seattle SuperSonics are not on the list as that team moved and became the Oklahoma City Thunder.
Examples
library(ggplot2)
library(dplyr)
library(openintro)
teams_with_apps <- nba_finals_teams |>
filter(apps != 0)
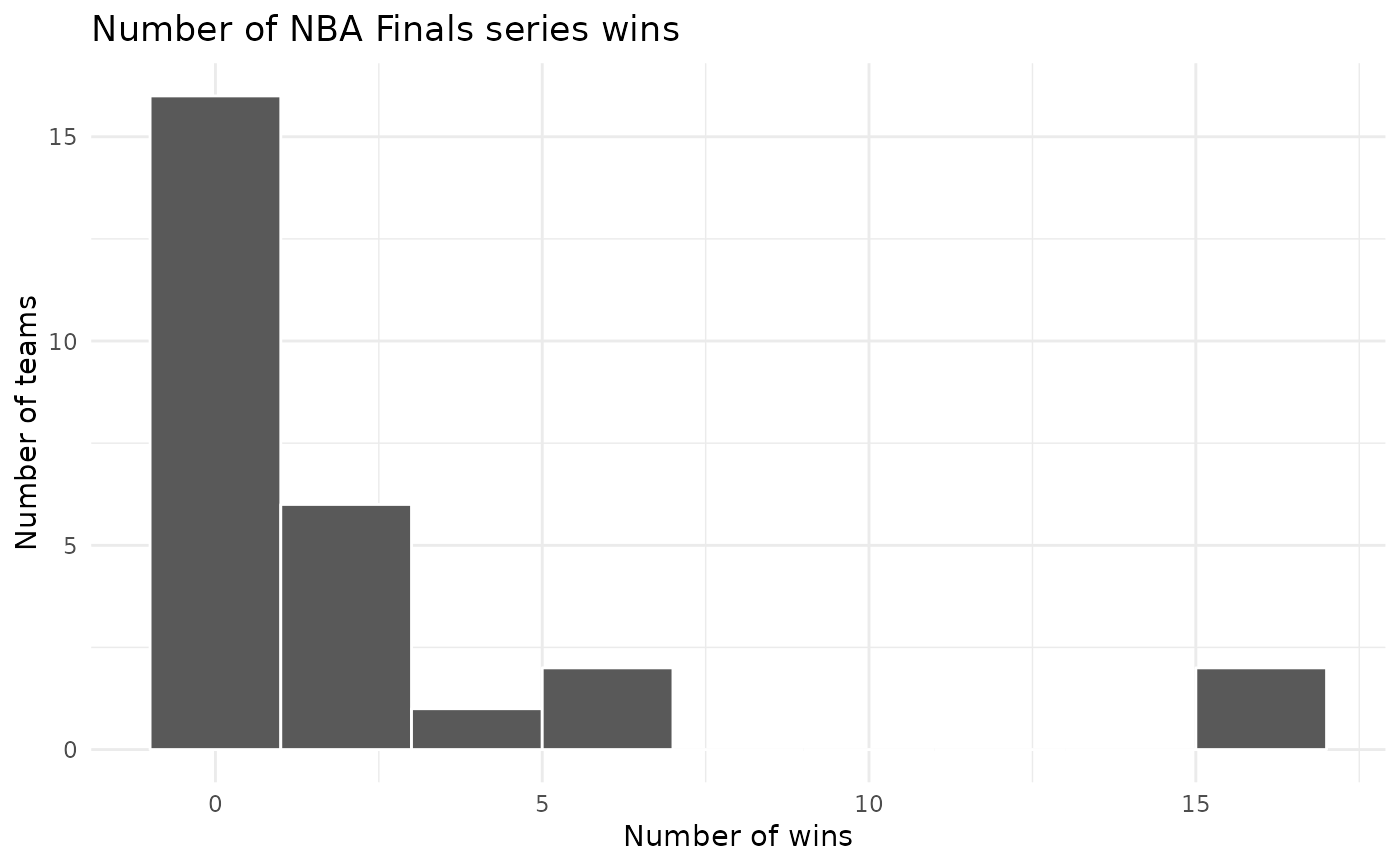
ggplot(teams_with_apps, aes(x = win)) +
geom_histogram(binwidth = 2) +
labs(
title = "Number of NBA Finals series wins",
x = "Number of wins",
y = "Number of teams"
)
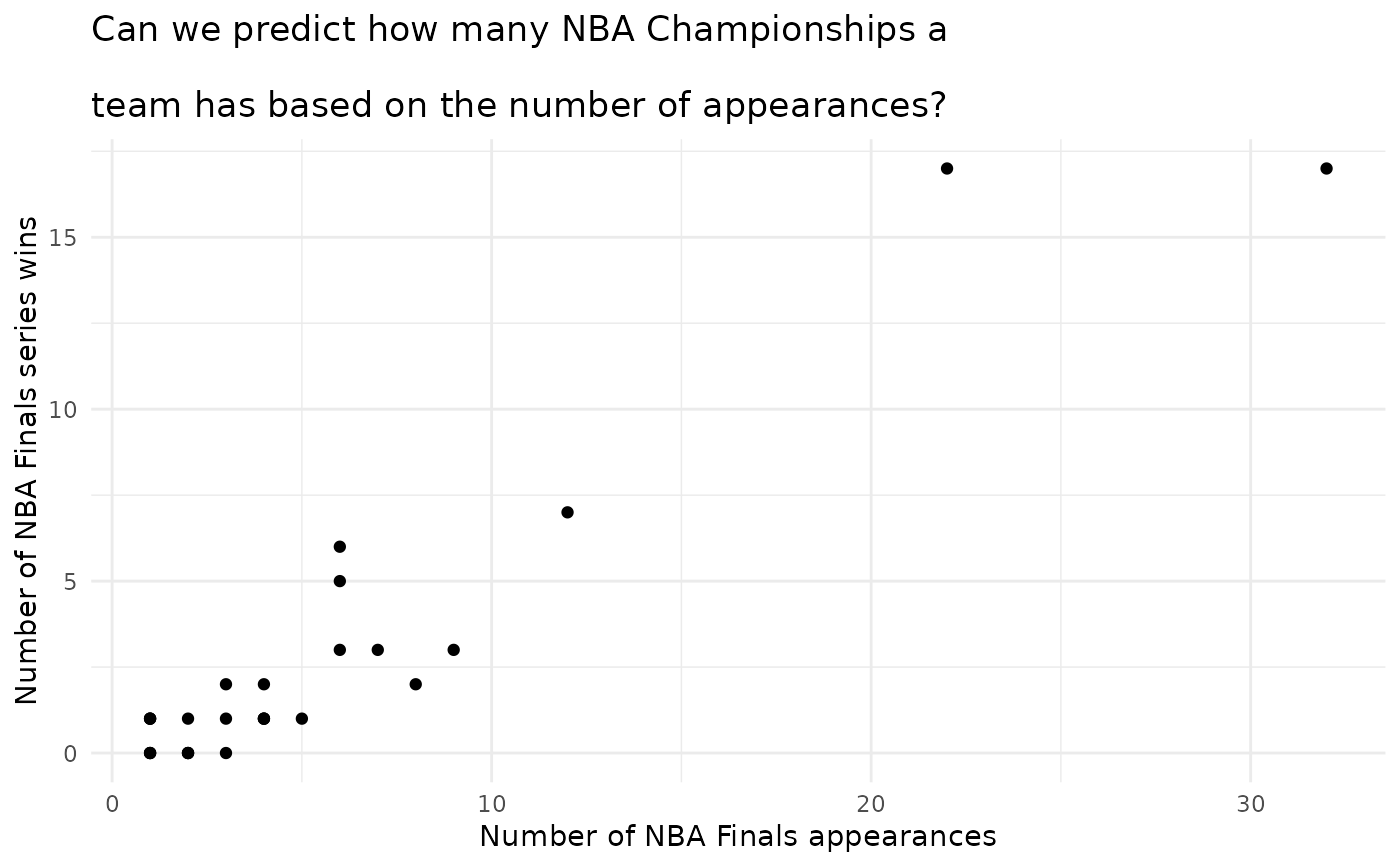
 ggplot(teams_with_apps, aes(x = apps, y = win)) +
geom_point(alpha = 0.3) +
labs(
title = "Can we predict how many NBA Championships a
team has based on the number of appearances?",
x = "Number of NBA Finals appearances",
y = "Number of NBA Finals series wins"
)
ggplot(teams_with_apps, aes(x = apps, y = win)) +
geom_point(alpha = 0.3) +
labs(
title = "Can we predict how many NBA Championships a
team has based on the number of appearances?",
x = "Number of NBA Finals appearances",
y = "Number of NBA Finals series wins"
)