Batter Statistics for 2018 Major League Baseball (MLB) Season
Source:R/data-mlb_players_18.R
mlb_players_18.RdBatter statistics for 2018 Major League Baseball season.
Format
A data frame with 1270 observations on the following 19 variables.
- name
Player name
- team
Team abbreviation
- position
Position abbreviation:
1B= first base,2B= second base,3B= third base,C= catcher,CF= center field (outfield),DH= designated hitter,LF= left field (outfield),P= pitcher,RF= right field (outfield),SS= shortstop.- games
Number of games played.
- AB
At bats.
- R
Runs.
- H
Hits.
- doubles
Doubles.
- triples
Triples.
- HR
Home runs.
- RBI
Runs batted in.
- walks
Walks.
- strike_outs
Strike outs.
- stolen_bases
Stolen bases.
- caught_stealing_base
Number of times caught stealing a base.
- AVG
Batting average.
- OBP
On-base percentage.
- SLG
Slugging percentage.
- OPS
On-base percentage plus slugging percentage.
Examples
d <- subset(mlb_players_18, !position %in% c("P", "DH") & AB >= 100)
dim(d)
#> [1] 429  19

# _____ Per Position, No Further Grouping _____ #
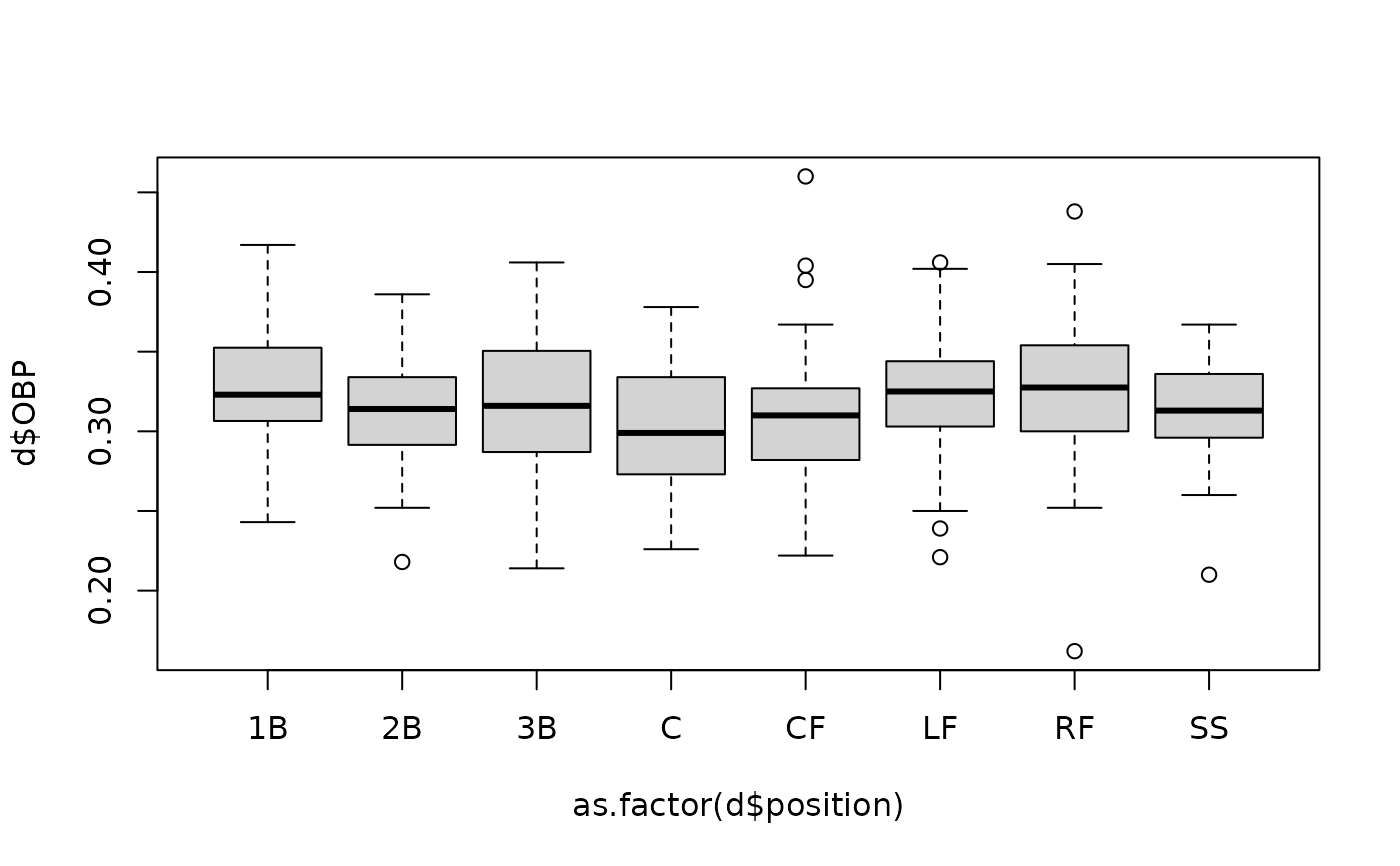
plot(d$OBP ~ as.factor(d$position))

model <- lm(OBP ~ as.factor(position), d)
summary(model)
#>
#> Call:
#> lm(formula = OBP ~ as.factor(position), data = d)
#>
#> Residuals:
#>       Min        1Q    Median        3Q       Max
#> -0.162185 -0.024185 -0.000745  0.026063  0.149038
#>
#> Coefficients:
#>                        Estimate Std. Error t value             Pr(>|t|)
#> (Intercept)            0.328490   0.005544  59.252 < 0.0000000000000002 ***
#> as.factor(position)2B -0.013562   0.007663  -1.770             0.077506 .
#> as.factor(position)3B -0.010745   0.007696  -1.396             0.163433
#> as.factor(position)C  -0.026553   0.007432  -3.573             0.000394 ***
#> as.factor(position)CF -0.017528   0.007766  -2.257             0.024520 *
#> as.factor(position)LF -0.004264   0.007766  -0.549             0.583277
#> as.factor(position)RF -0.004305   0.007731  -0.557             0.577911
#> as.factor(position)SS -0.016769   0.008197  -2.046             0.041397 *
#> ---
#> Signif. codes:  0 ‘***’ 0.001 ‘**’ 0.01 ‘*’ 0.05 ‘.’ 0.1 ‘ ’ 1
#>
#> Residual standard error: 0.03959 on 421 degrees of freedom
#> Multiple R-squared:  0.04361,	Adjusted R-squared:  0.0277
#> F-statistic: 2.742 on 7 and 421 DF,  p-value: 0.008569
#>
anova(model)
#> Analysis of Variance Table
#>
#> Response: OBP
#>                      Df  Sum Sq   Mean Sq F value   Pr(>F)
#> as.factor(position)   7 0.03009 0.0042983  2.7421 0.008569 **
#> Residuals           421 0.65992 0.0015675
#> ---
#> Signif. codes:  0 ‘***’ 0.001 ‘**’ 0.01 ‘*’ 0.05 ‘.’ 0.1 ‘ ’ 1

# _____ Simplified Analysis, Fewer Positions _____ #
pos <- list(
  c("LF", "CF", "RF"),
  c("1B", "2B", "3B", "SS"),
  "C"
)
POS <- c("OF", "IF", "C")
table(d$position)
#>
#> 1B 2B 3B  C CF LF RF SS
#> 51 56 55 64 53 53 54 43

# _____ On-Base Percentage Across Positions _____ #
out <- c()
gp <- c()
for (i in 1:length(pos)) {
  these <- which(d$position %in% pos[[i]])
  out <- c(out, d$OBP[these])
  gp <- c(gp, rep(POS[i], length(these)))
}
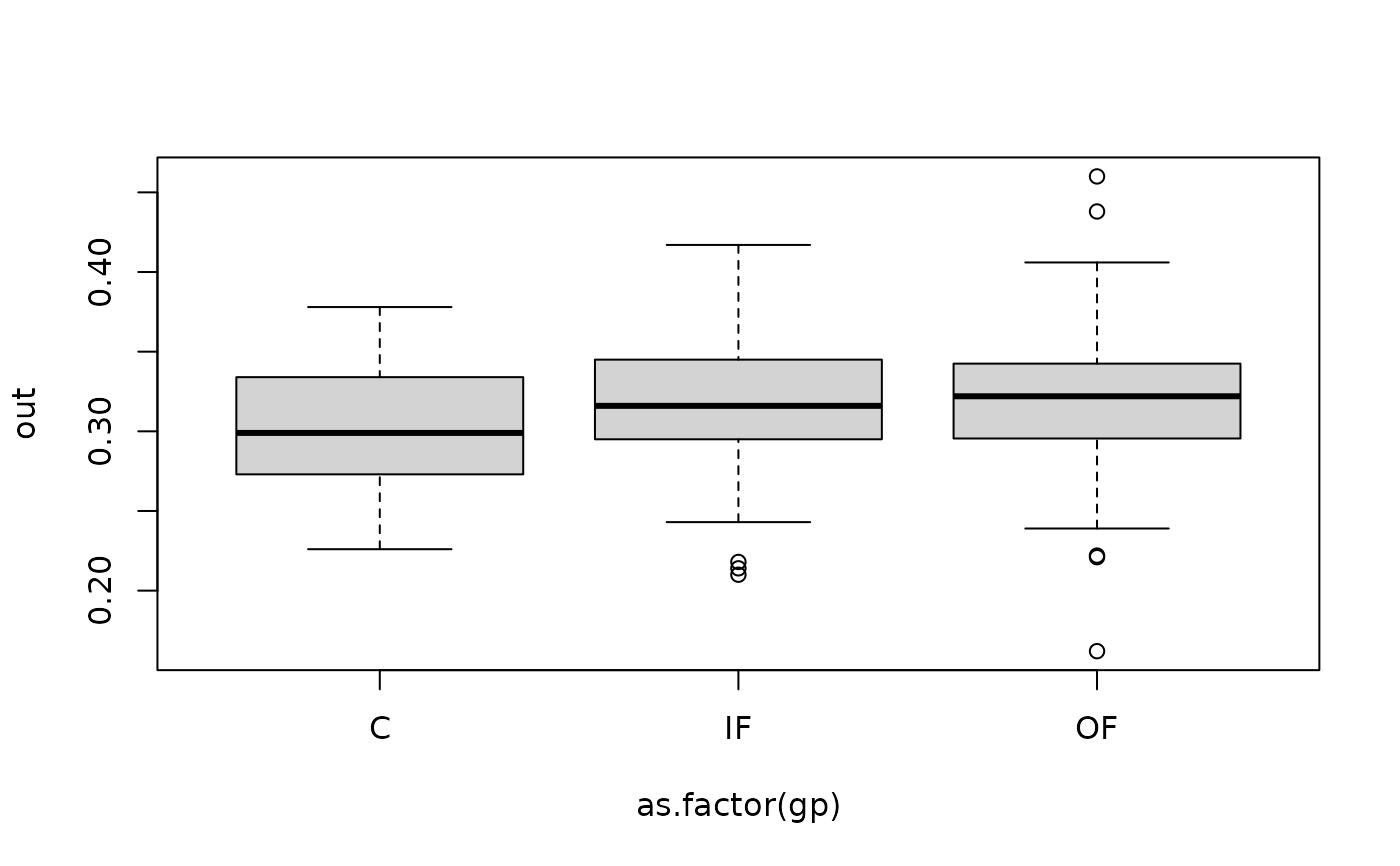
plot(out ~ as.factor(gp))

summary(lm(out ~ as.factor(gp)))
#>
#> Call:
#> lm(formula = out ~ as.factor(gp))
#>
#> Residuals:
#>       Min        1Q    Median        3Q       Max
#> -0.157819 -0.024819 -0.001385  0.027062  0.140181
#>
#> Coefficients:
#>                 Estimate Std. Error t value             Pr(>|t|)
#> (Intercept)     0.301937   0.004972  60.729 < 0.0000000000000002 ***
#> as.factor(gp)IF 0.016448   0.005695   2.888              0.00408 **
#> as.factor(gp)OF 0.017881   0.005883   3.040              0.00252 **
#> ---
#> Signif. codes:  0 ‘***’ 0.001 ‘**’ 0.01 ‘*’ 0.05 ‘.’ 0.1 ‘ ’ 1
#>
#> Residual standard error: 0.03977 on 426 degrees of freedom
#> Multiple R-squared:  0.02328,	Adjusted R-squared:  0.01869
#> F-statistic: 5.077 on 2 and 426 DF,  p-value: 0.006624
#>
anova(lm(out ~ as.factor(gp)))
#> Analysis of Variance Table
#>
#> Response: out
#>                Df  Sum Sq   Mean Sq F value   Pr(>F)
#> as.factor(gp)   2 0.01606 0.0080314  5.0766 0.006624 **
#> Residuals     426 0.67395 0.0015820
#> ---
#> Signif. codes:  0 ‘***’ 0.001 ‘**’ 0.01 ‘*’ 0.05 ‘.’ 0.1 ‘ ’ 1