Two hundred observations were randomly sampled from the High School and Beyond survey, a survey conducted on high school seniors by the National Center of Education Statistics.
Format
A data frame with 200 observations and 11 variables.
- id
Student ID.
- gender
Student's gender, with levels
femaleandmale.- race
Student's race, with levels
african american,asian,hispanic, andwhite.- ses
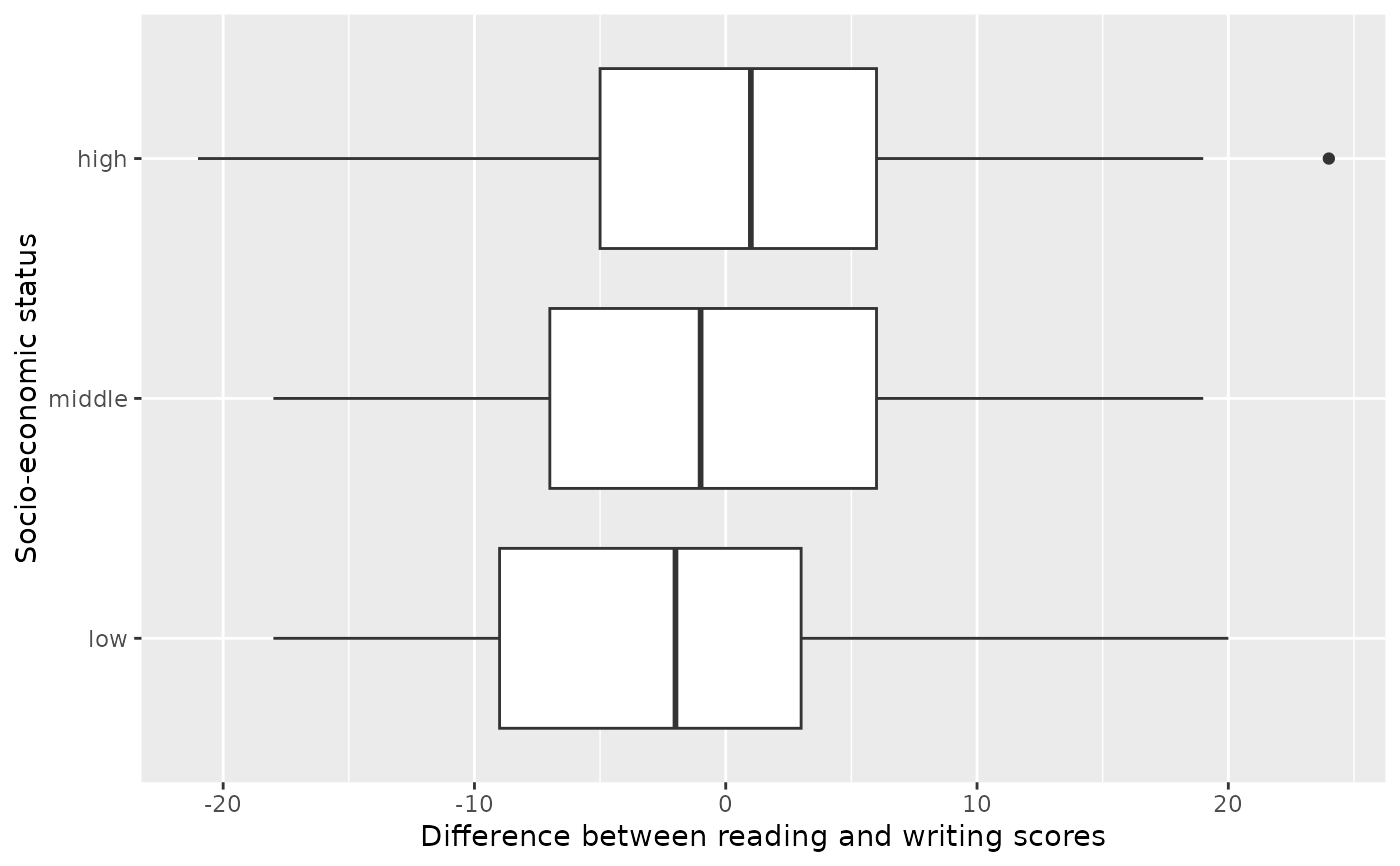
Socio economic status of student's family, with levels
low,middle, andhigh.- schtyp
Type of school, with levels
publicandprivate.- prog
Type of program, with levels
general,academic, andvocational.- read
Standardized reading score.
- write
Standardized writing score.
- math
Standardized math score.
- science
Standardized science score.
- socst
Standardized social studies score.