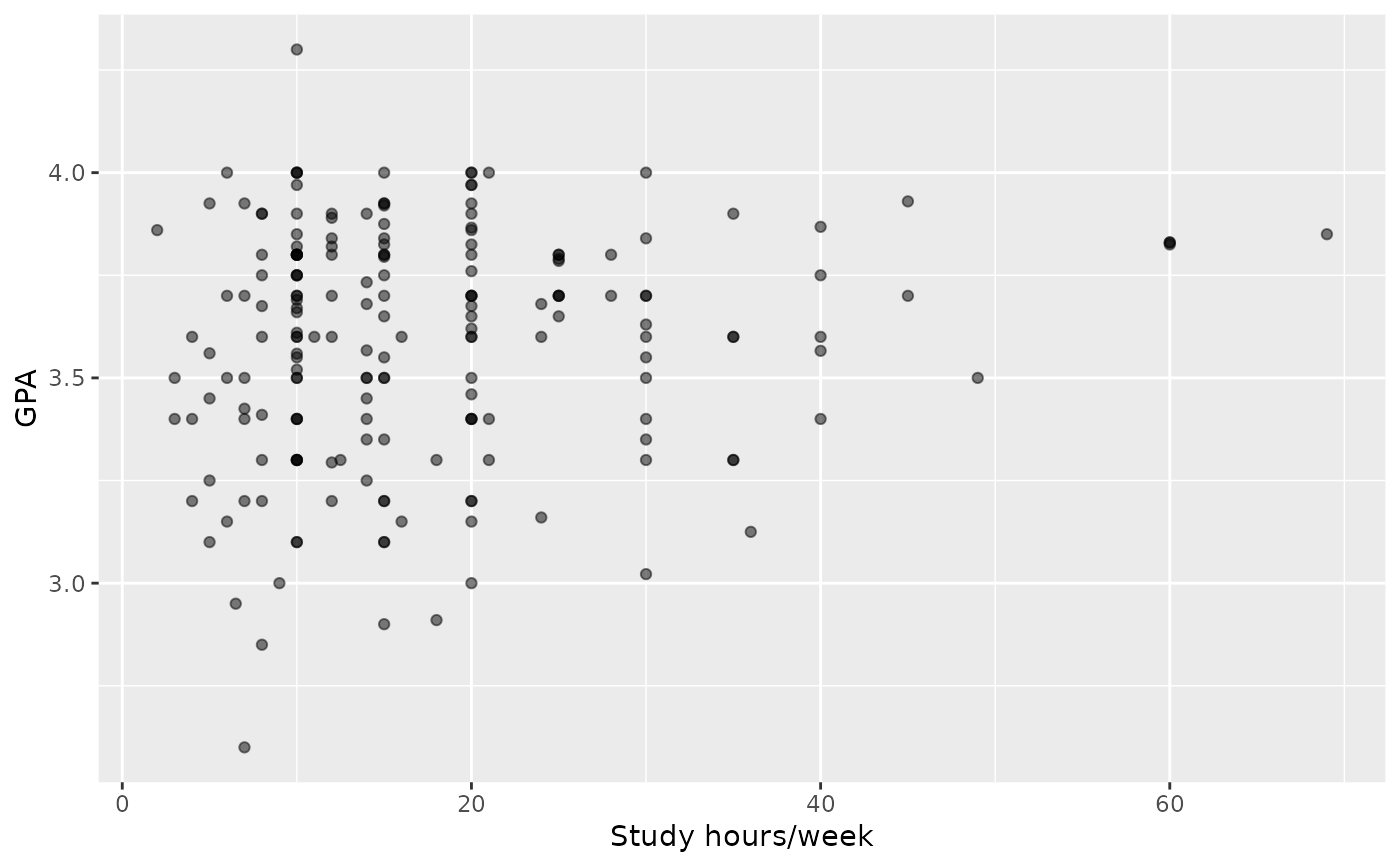
A data frame with 193 rows and 2 columns. The columns represent the
variables gpa and study_hours for a sample of 193
undergraduate students who took an introductory statistics course in 2012 at
a private US university.
Format
A data frame with 193 observations on the following 2 variables.
- gpa
Grade point average (GPA) of student.
- study_hours
Number of hours students study per week.
Source
Collected at a private US university as part of an anonymous survey in an introductory statistics course.