Flow rates (mesured in cubic feet per second) of Clarks Creek, Leach Creek, Silver Creek, and Wildwood Creek Spring collected by volunteers of the Pierce Conservation District in the State of Washington in the US.
Format
A data frame with 31 rows and 3 variables.
- site
Location where measurements were taken.
- date
Date measurements were taken.
- flow
Flow rate of the river in cubic feet per second.
Examples
library(ggplot2)
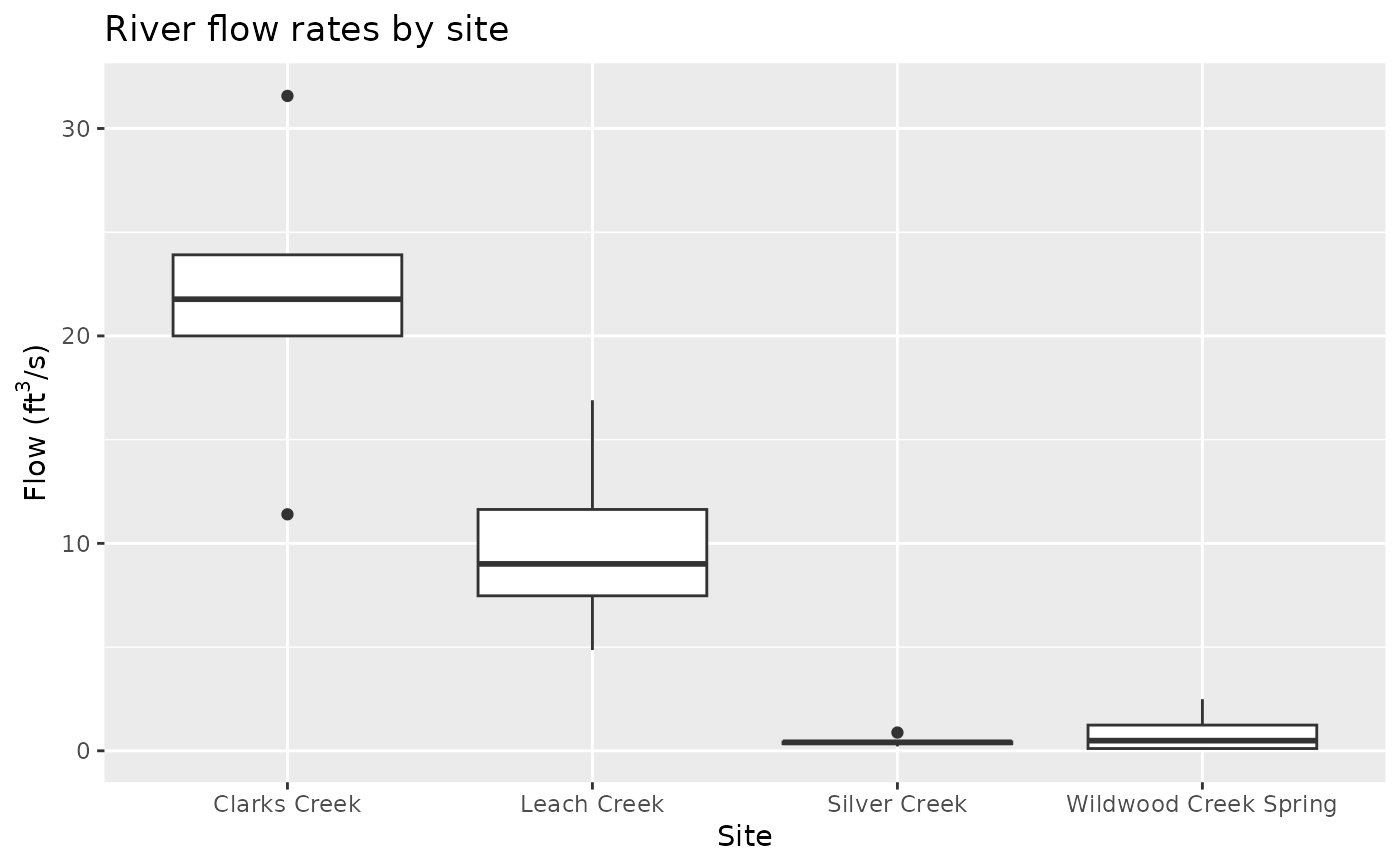
# River flow rates by site
ggplot(flow_rates, aes(x = site, y = flow)) +
geom_boxplot() +
labs(
title = "River flow rates by site",
x = "Site",
y = expression(paste("Flow (ft"^3 * "/s)"))
)
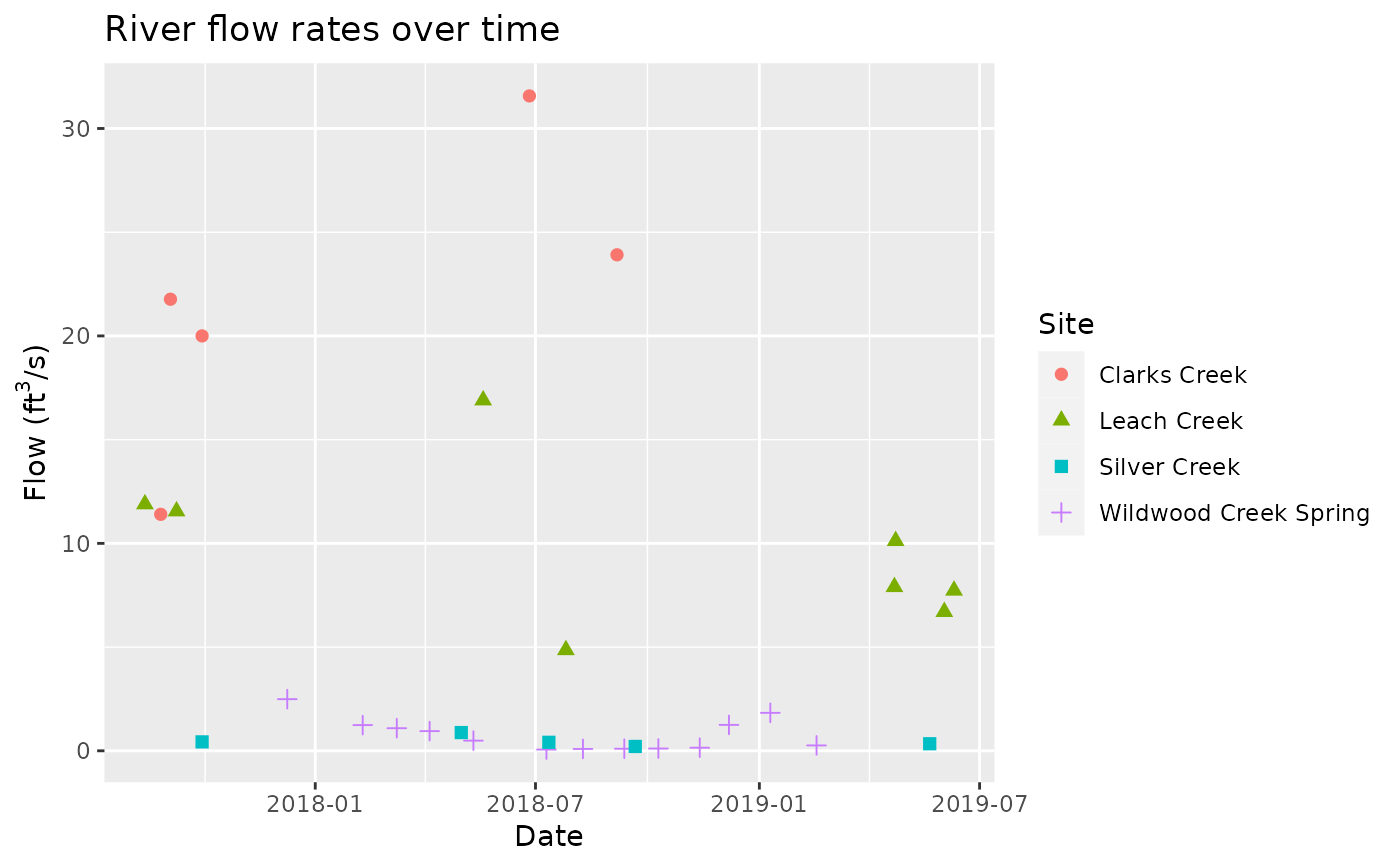
 # River flow rates over time
ggplot(flow_rates, aes(x = date, y = flow, color = site, shape = site)) +
geom_point(size = 2) +
labs(
title = "River flow rates over time",
x = "Date",
y = expression(paste("Flow (ft"^3 * "/s)")),
color = "Site", shape = "Site"
)
# River flow rates over time
ggplot(flow_rates, aes(x = date, y = flow, color = site, shape = site)) +
geom_point(size = 2) +
labs(
title = "River flow rates over time",
x = "Date",
y = expression(paste("Flow (ft"^3 * "/s)")),
color = "Site", shape = "Site"
)