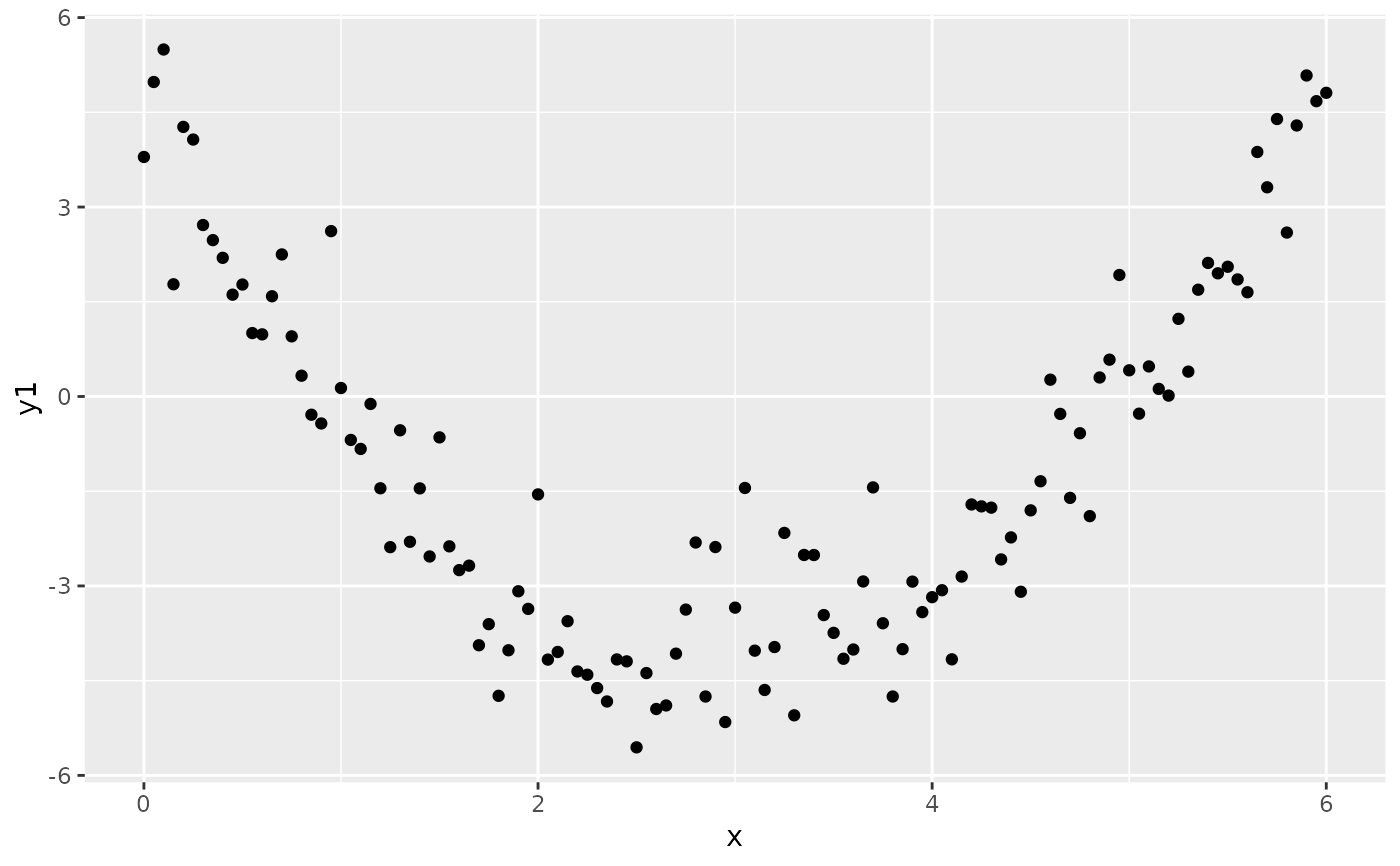
A data frame with 121 observations on the following 9 variables.
- x
a numeric vector
- y1
a numeric vector
- y2
a numeric vector
- y3
a numeric vector
- y4
a numeric vector
- y5
a numeric vector
- y6
a numeric vector
- y7
a numeric vector
- y8
a numeric vector
Source
Simulated dataset.