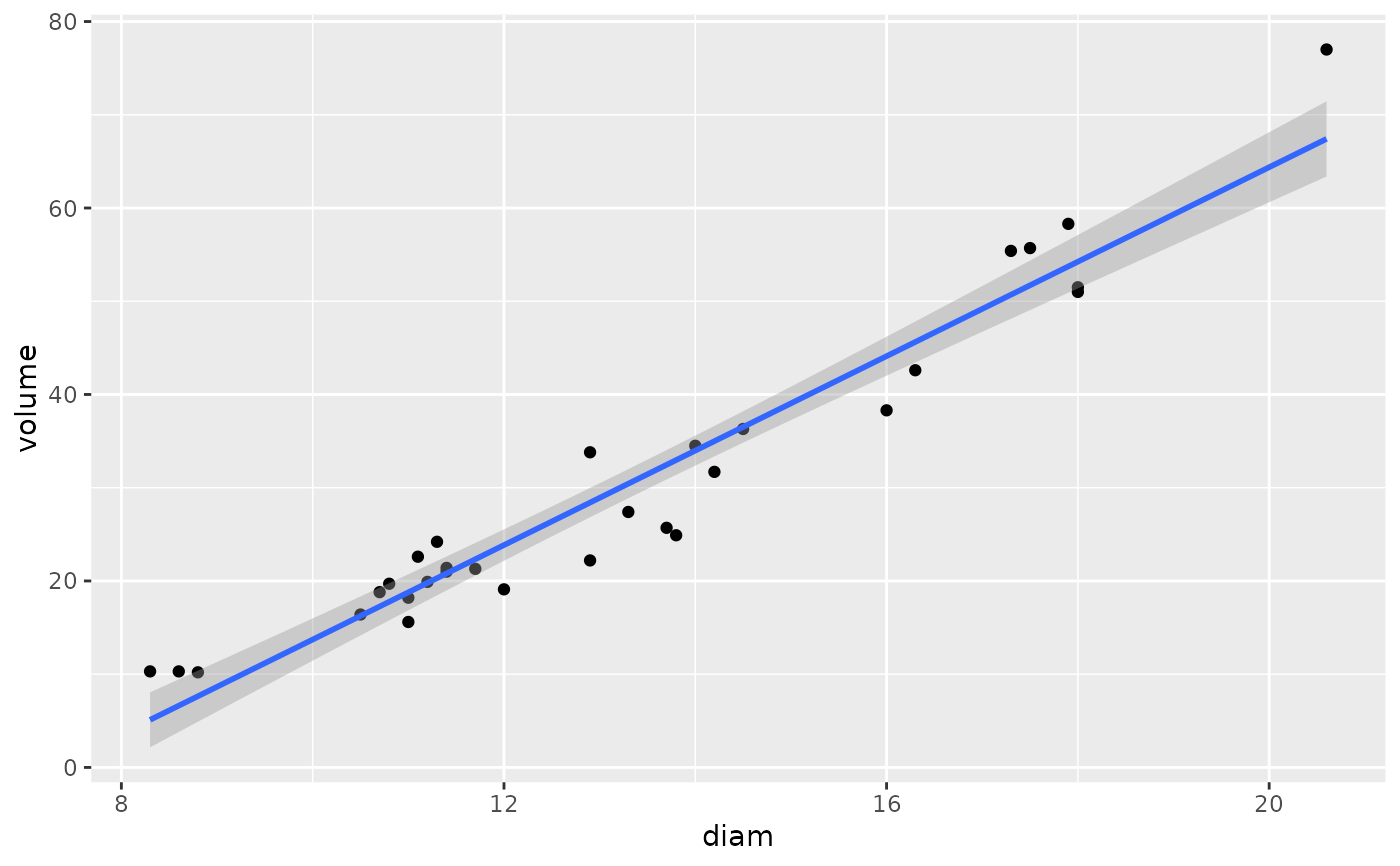
Researchers wanting to understand the relationship between these variables for black cherry trees collected data from 31 trees in the Allegheny National Forest, Pennsylvania.
Format
A data frame with 31 observations on the following 3 variables.
- diam
diameter in inches (at 54 inches above ground)
- height
height is measured in feet
- volume
volume in cubic feet
Examples
library(ggplot2)
library(broom)

ggplot(cherry, aes(x = diam, y = volume)) +
  geom_point() +
  geom_smooth(method = "lm")
#> `geom_smooth()` using formula = 'y ~ x'


mod <- lm(volume ~ diam + height, cherry)
tidy(mod)
#> # A tibble: 3 × 5
#>   term        estimate std.error statistic  p.value
#>   <chr>          <dbl>     <dbl>     <dbl>    <dbl>
#> 1 (Intercept)  -58.0       8.64      -6.71 2.75e- 7
#> 2 diam           4.71      0.264     17.8  8.22e-17
#> 3 height         0.339     0.130      2.61 1.45e- 2
mod <- lm(volume ~ diam + height, cherry)
tidy(mod)
#> # A tibble: 3 × 5
#> term estimate std.error statistic p.value
#> <chr> <dbl> <dbl> <dbl> <dbl>
#> 1 (Intercept) -58.0 8.64 -6.71 2.75e- 7
#> 2 diam 4.71 0.264 17.8 8.22e-17
#> 3 height 0.339 0.130 2.61 1.45e- 2