A random sample of 500 observations from the 2000 U.S. Census Data.
Format
A data frame with 500 observations on the following 8 variables.
- census_year
Census Year.
- state_fips_code
Name of state.
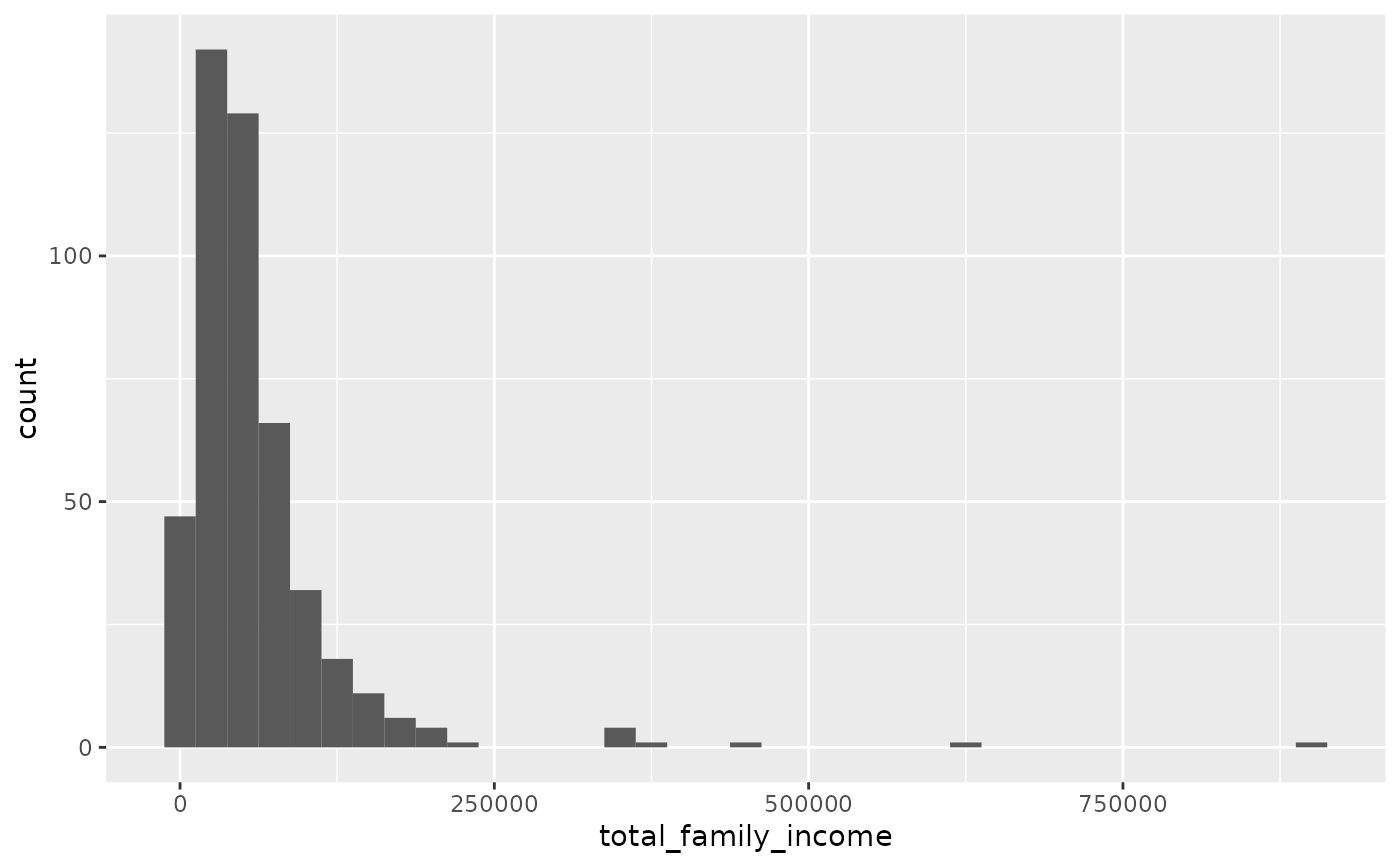
- total_family_income
Total family income (in U.S. dollars).
- age
Age.
- sex
Sex with levels
FemaleandMale.- race_general
Race with levels
American Indian or Alaska Native,Black,Chinese,Japanese,Other Asian or Pacific Islander,Two major races,WhiteandOther.- marital_status
Marital status with levels
Divorced,Married/spouse absent,Married/spouse present,Never married/single,SeparatedandWidowed.- total_personal_income
Total personal income (in U.S. dollars).