The function buildAxis is built to provide more control of the number
of labels on the axis. This function is still under development.
Arguments
- side
The side of the plot where to add the axis.
- limits
Either lower and upper limits on the axis or a dataset.
- n
The preferred number of axis labels.
- nMin
The minimum number of axis labels.
- nMax
The maximum number of axis labels.
- extend
How far the axis may extend beyond
range(limits).- eps
The smallest increment allowed.
- ...
Arguments passed to
axis
Details
The primary reason behind building this function was to allow a plot to be
created with similar features but with different datasets. For instance, if
a set of code was written for one dataset and the function axis had
been utilized with pre-specified values, the axis may not match the plot of
a new set of data. The function buildAxis addresses this problem by
allowing the number of axis labels to be specified and controlled.
The axis is built by assigning penalties to a variety of potential axis setups, ranking them based on these penalties and then selecting the axis with the best score.
Examples
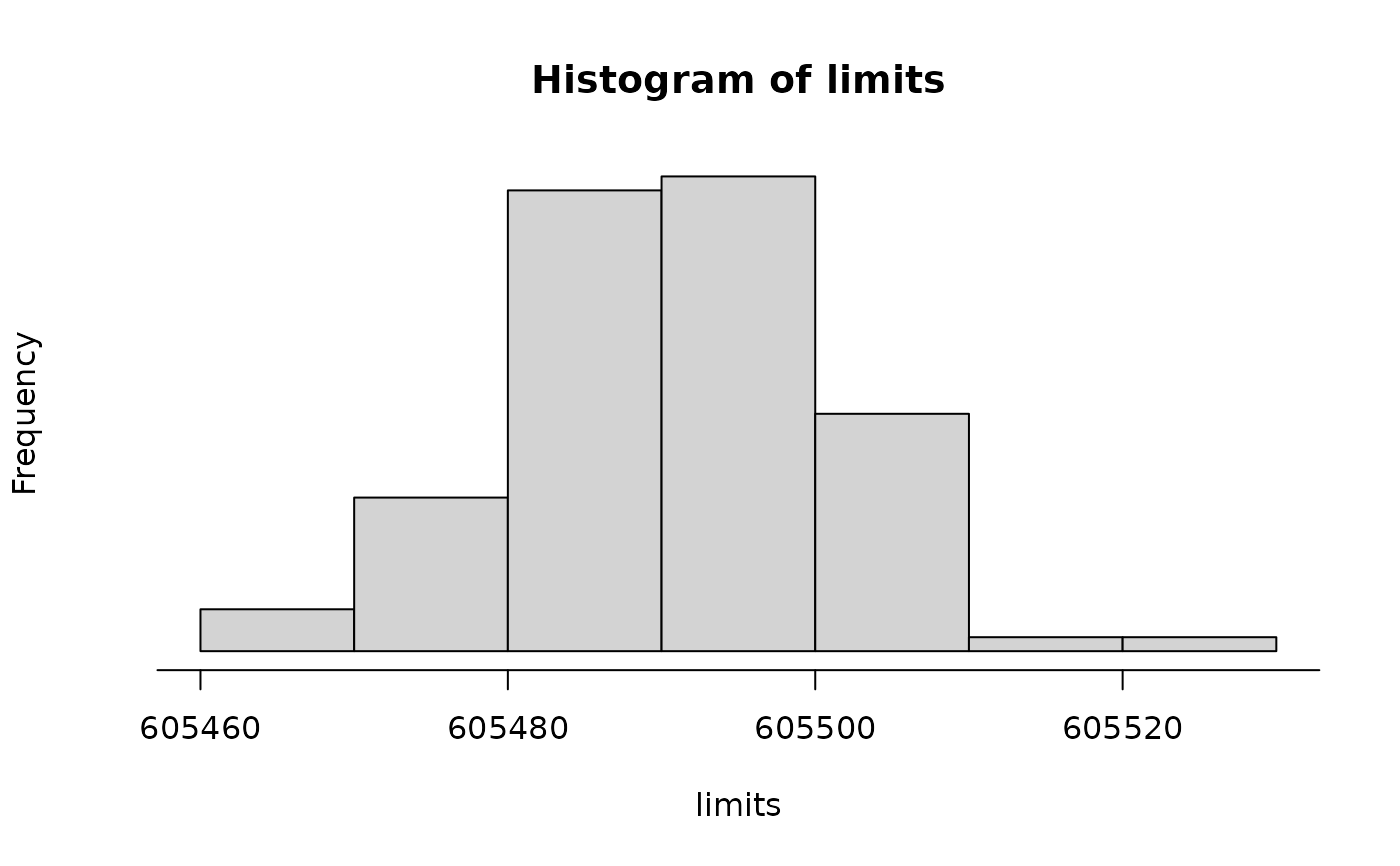
# ===> 0 <===#
limits <- rnorm(100, 605490, 10)
hist(limits, axes = FALSE)
buildAxis(1, limits, 2, nMax = 4)
 # ===> 1 <===#
x <- seq(0, 500, 10)
y <- 8 * x + rnorm(length(x), mean = 6000, sd = 200)
plot(x, y, axes = FALSE)
buildAxis(1, limits = x, n = 5)
buildAxis(2, limits = y, n = 3)
# ===> 1 <===#
x <- seq(0, 500, 10)
y <- 8 * x + rnorm(length(x), mean = 6000, sd = 200)
plot(x, y, axes = FALSE)
buildAxis(1, limits = x, n = 5)
buildAxis(2, limits = y, n = 3)
 # ===> 2 <===#
x <- 9528412 + seq(0, 200, 10)
y <- 8 * x + rnorm(length(x), mean = 6000, sd = 200)
plot(x, y, axes = FALSE)
temp <- buildAxis(1, limits = x, n = 4)
buildAxis(2, y, 3)
# ===> 2 <===#
x <- 9528412 + seq(0, 200, 10)
y <- 8 * x + rnorm(length(x), mean = 6000, sd = 200)
plot(x, y, axes = FALSE)
temp <- buildAxis(1, limits = x, n = 4)
buildAxis(2, y, 3)
 # ===> 3 <===#
x <- seq(367, 1251, 10)
y <- 7.5 * x + rnorm(length(x), mean = 6000, sd = 800)
plot(x, y, axes = FALSE)
buildAxis(1, limits = x, n = 4, nMin = 3, nMax = 3)
buildAxis(2, limits = y, n = 4, nMin = 3, nMax = 5)
# ===> 3 <===#
x <- seq(367, 1251, 10)
y <- 7.5 * x + rnorm(length(x), mean = 6000, sd = 800)
plot(x, y, axes = FALSE)
buildAxis(1, limits = x, n = 4, nMin = 3, nMax = 3)
buildAxis(2, limits = y, n = 4, nMin = 3, nMax = 5)
 # ===> 4 <===#
x <- seq(367, 367.1, 0.001)
y <- 7.5 * x + rnorm(length(x), mean = 6000, sd = 0.01)
plot(x, y, axes = FALSE)
buildAxis(1, limits = x, n = 4, nMin = 5, nMax = 6)
buildAxis(2, limits = y, n = 2, nMin = 3, nMax = 4)
# ===> 4 <===#
x <- seq(367, 367.1, 0.001)
y <- 7.5 * x + rnorm(length(x), mean = 6000, sd = 0.01)
plot(x, y, axes = FALSE)
buildAxis(1, limits = x, n = 4, nMin = 5, nMax = 6)
buildAxis(2, limits = y, n = 2, nMin = 3, nMax = 4)
 # ===> 5 <===#
x <- seq(-0.05, -0.003, 0.0001)
y <- 50 + 20 * x + rnorm(length(x), sd = 0.1)
plot(x, y, axes = FALSE)
buildAxis(1, limits = x, n = 4, nMin = 5, nMax = 6)
buildAxis(2, limits = y, n = 4, nMax = 5)
abline(lm(y ~ x))
# ===> 5 <===#
x <- seq(-0.05, -0.003, 0.0001)
y <- 50 + 20 * x + rnorm(length(x), sd = 0.1)
plot(x, y, axes = FALSE)
buildAxis(1, limits = x, n = 4, nMin = 5, nMax = 6)
buildAxis(2, limits = y, n = 4, nMax = 5)
abline(lm(y ~ x))
 # ===> 6 <===#
x <- seq(-0.0097, -0.008, 0.0001)
y <- 50 + 20 * x + rnorm(length(x), sd = 0.1)
plot(x, y, axes = FALSE)
buildAxis(1, limits = x, n = 4, nMin = 2, nMax = 5)
buildAxis(2, limits = y, n = 4, nMax = 5)
abline(lm(y ~ x))
# ===> 6 <===#
x <- seq(-0.0097, -0.008, 0.0001)
y <- 50 + 20 * x + rnorm(length(x), sd = 0.1)
plot(x, y, axes = FALSE)
buildAxis(1, limits = x, n = 4, nMin = 2, nMax = 5)
buildAxis(2, limits = y, n = 4, nMax = 5)
abline(lm(y ~ x))
 # ===> 7 <===#
x <- seq(0.03, -0.003099, -0.00001)
y <- 50 + 20 * x + rnorm(length(x), sd = 0.1)
plot(x, y, axes = FALSE)
buildAxis(1, limits = x, n = 4, nMin = 2, nMax = 5)
buildAxis(2, limits = y, n = 4, nMax = 6)
abline(lm(y ~ x))
# ===> 7 <===#
x <- seq(0.03, -0.003099, -0.00001)
y <- 50 + 20 * x + rnorm(length(x), sd = 0.1)
plot(x, y, axes = FALSE)
buildAxis(1, limits = x, n = 4, nMin = 2, nMax = 5)
buildAxis(2, limits = y, n = 4, nMax = 6)
abline(lm(y ~ x))
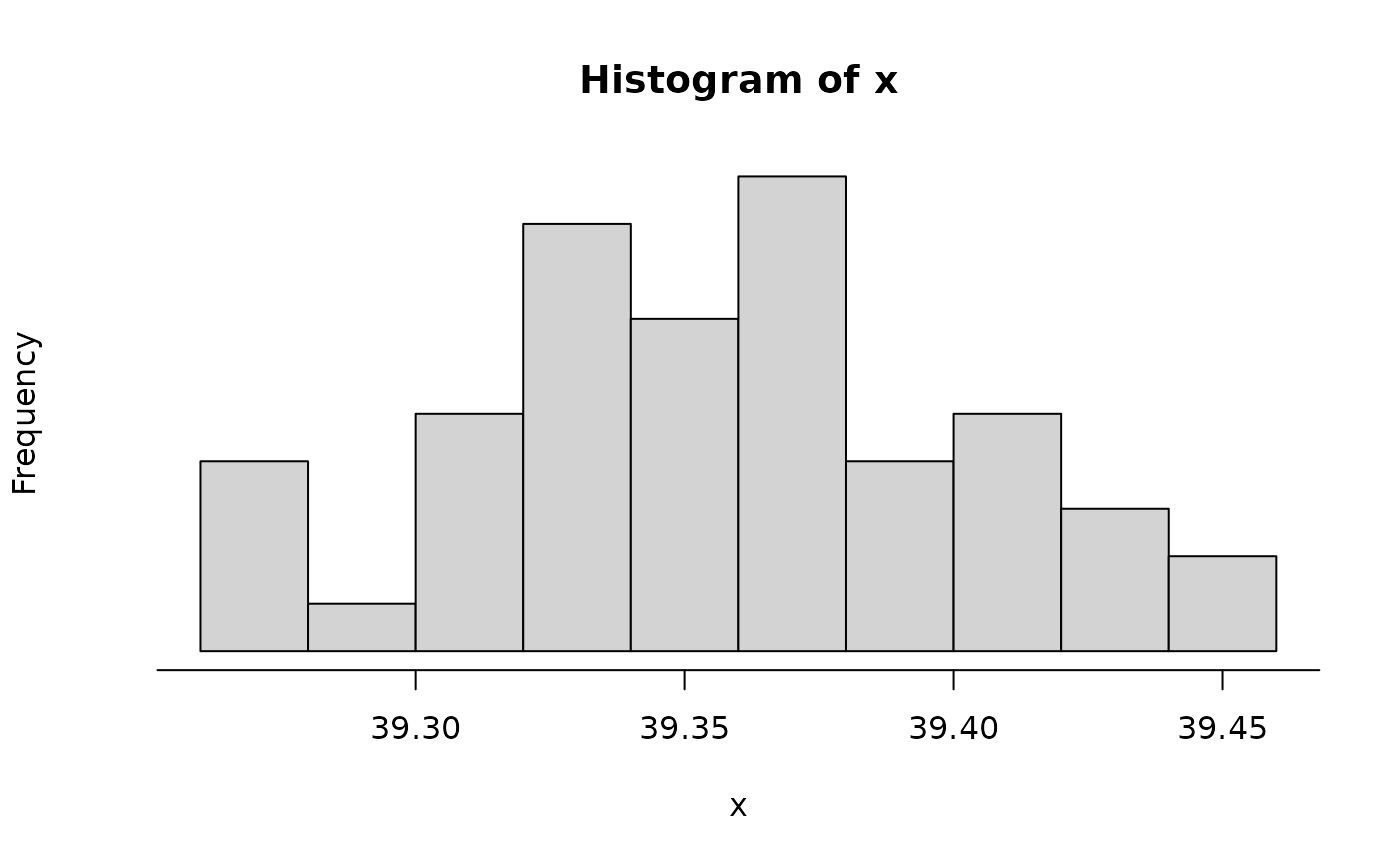
 # ===> 8 - repeat <===#
m <- runif(1) / runif(1) +
rgamma(1, runif(1) / runif(1), runif(1) / runif(1))
s <- rgamma(1, runif(1) / runif(1), runif(1) / runif(1))
x <- rnorm(50, m, s)
hist(x, axes = FALSE)
buildAxis(1, limits = x, n = 5, nMin = 4, nMax = 6, eps = 10^-12)
# ===> 8 - repeat <===#
m <- runif(1) / runif(1) +
rgamma(1, runif(1) / runif(1), runif(1) / runif(1))
s <- rgamma(1, runif(1) / runif(1), runif(1) / runif(1))
x <- rnorm(50, m, s)
hist(x, axes = FALSE)
buildAxis(1, limits = x, n = 5, nMin = 4, nMax = 6, eps = 10^-12)
 if (diff(range(x)) < 10^-12) {
cat("too small\n")
}
if (diff(range(x)) < 10^-12) {
cat("too small\n")
}