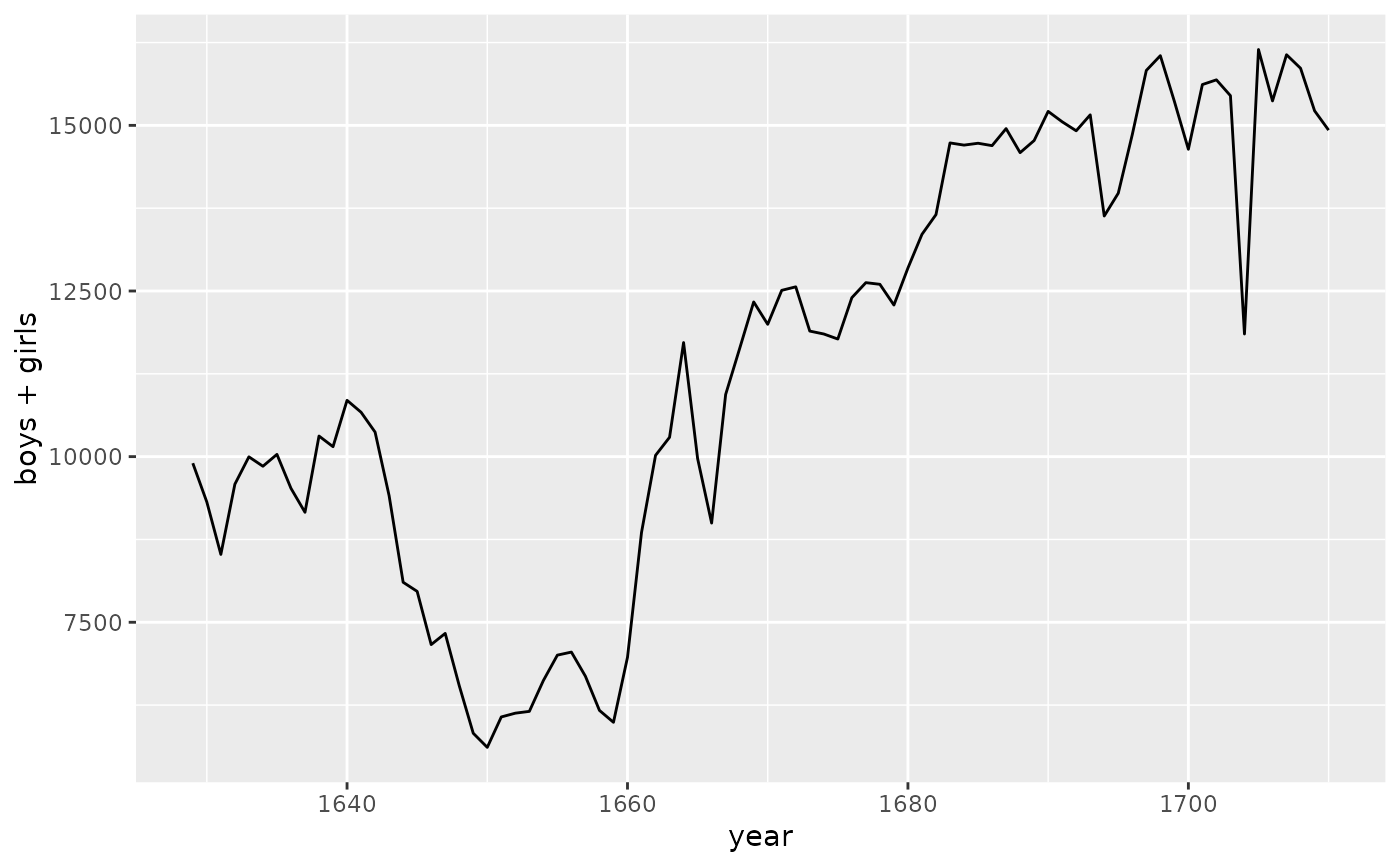
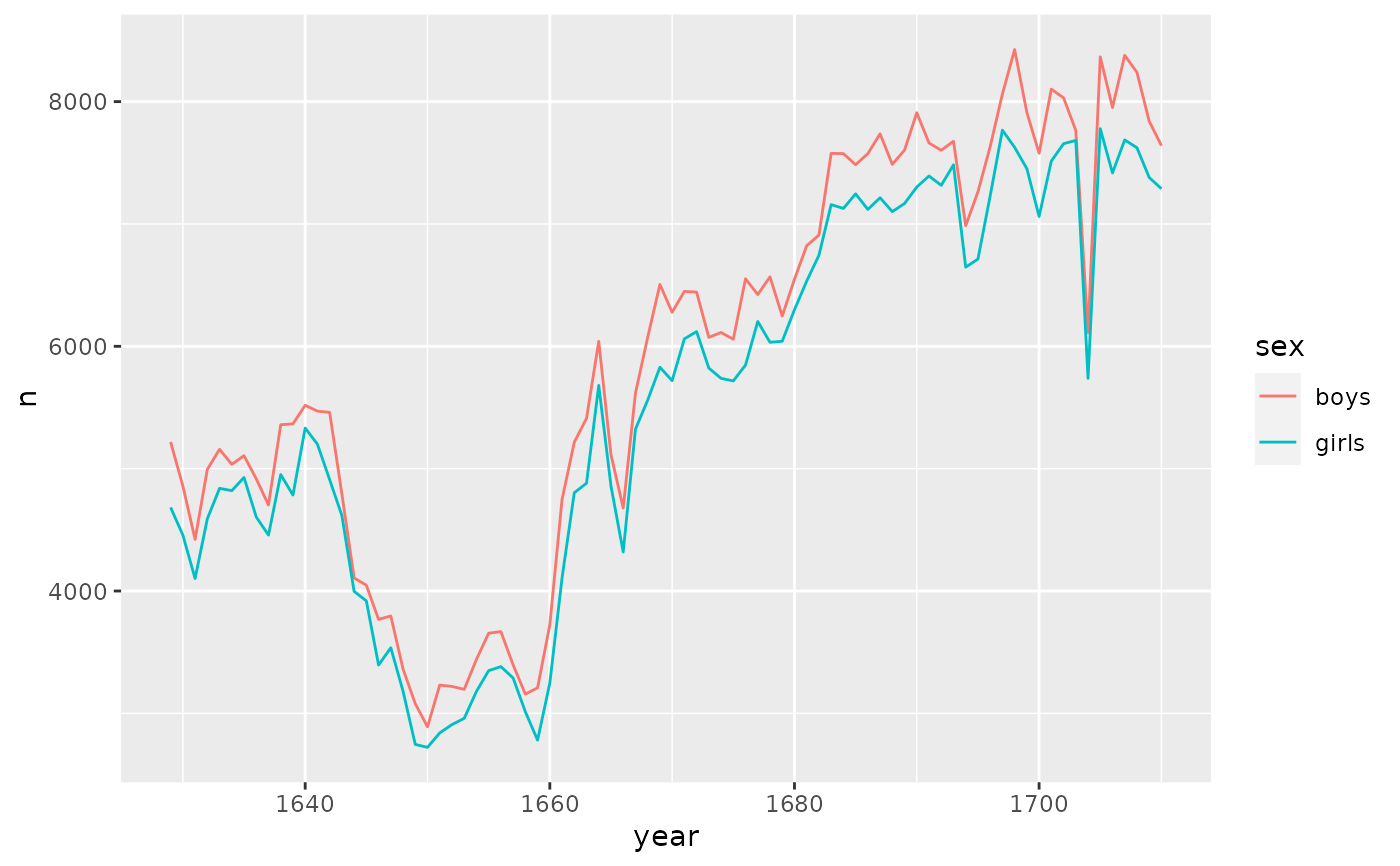
Arbuthnot's data describes male and female christenings (births) for London from 1629-1710.
Format
A tbl_df with with 82 rows and 3 variables:
- year
year, ranging from 1629 to 1710
- boys
number of male christenings (births)
- girls
number of female christenings (births)
Source
These data are excerpted from the Arbuthnot dataset in the
HistData package.
Details
John Arbuthnot (1710) used these time series data to carry out the first known significance test. During every one of the 82 years, there were more male christenings than female christenings. As Arbuthnot wondered, we might also wonder if this could be due to chance, or whether it meant the birth ratio was not actually 1:1.