Details for all 14,974 runners in the 2009 Cherry Blossom Run, which is an annual road race that takes place in Washington, DC.
Format
A data frame with 14,974 observations on the following 14 variables.
- place
Finishing position. Separate positions are provided for each gender.
- time
The total run time.
- net_time
The run time from the start line to the finish line.
- pace
Average time per mile, in minutes.
- age
Age.
- gender
Gender.
- first
First name.
- last
Last name.
- city
Hometown city.
- state
Hometown state.
- country
Hometown country.
- div
Running division (age group).
- div_place
Division place, also broken up by gender.
- div_tot
Total number of people in the division (again, also split by gender).
Examples
library(ggplot2)
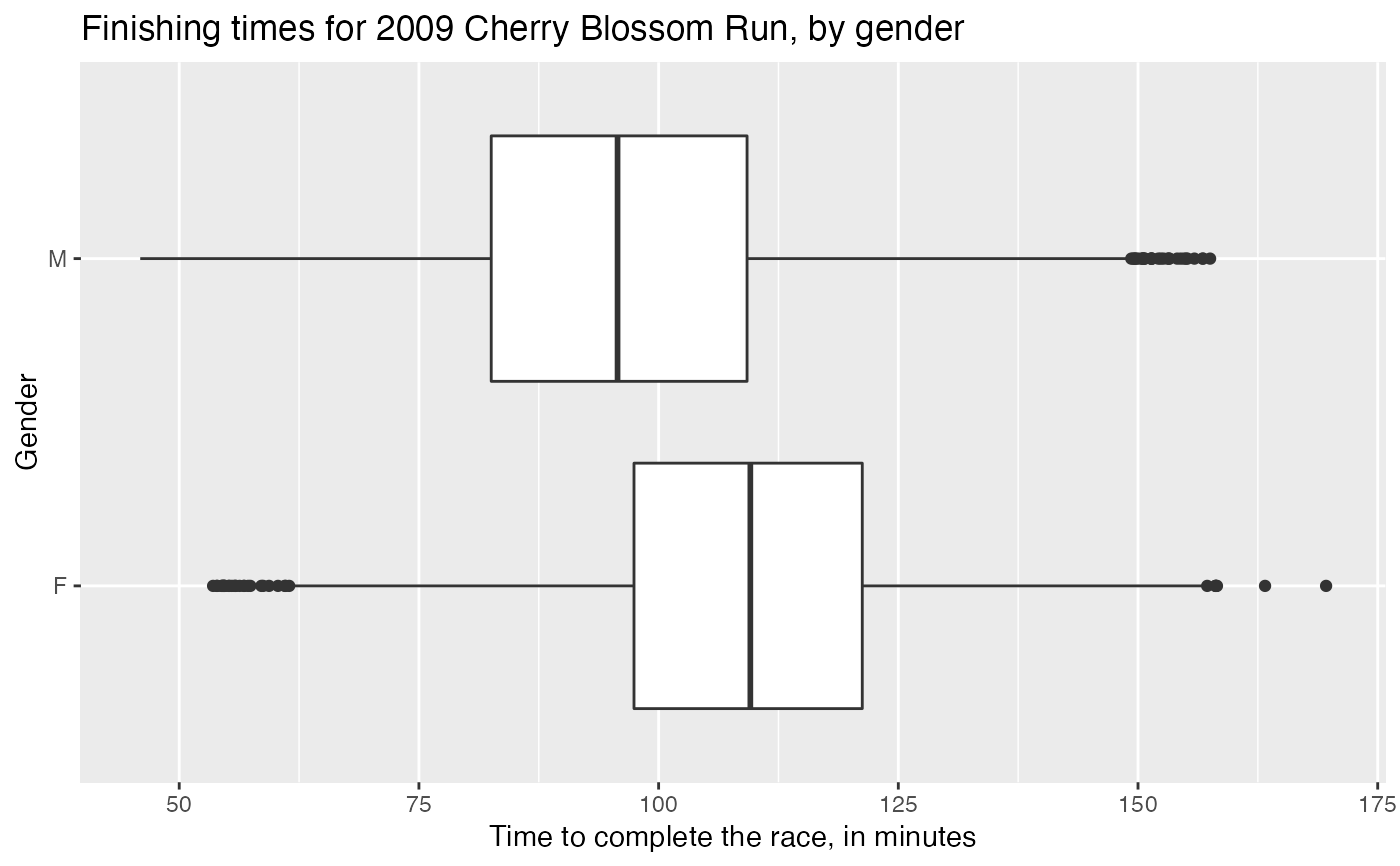
# Finishing times by gender
ggplot(run09, aes(x = time, y = gender)) +
geom_boxplot() +
labs(
title = "Finishing times for 2009 Cherry Blossom Run, by gender",
x = "Time to complete the race, in minutes",
y = "Gender"
)
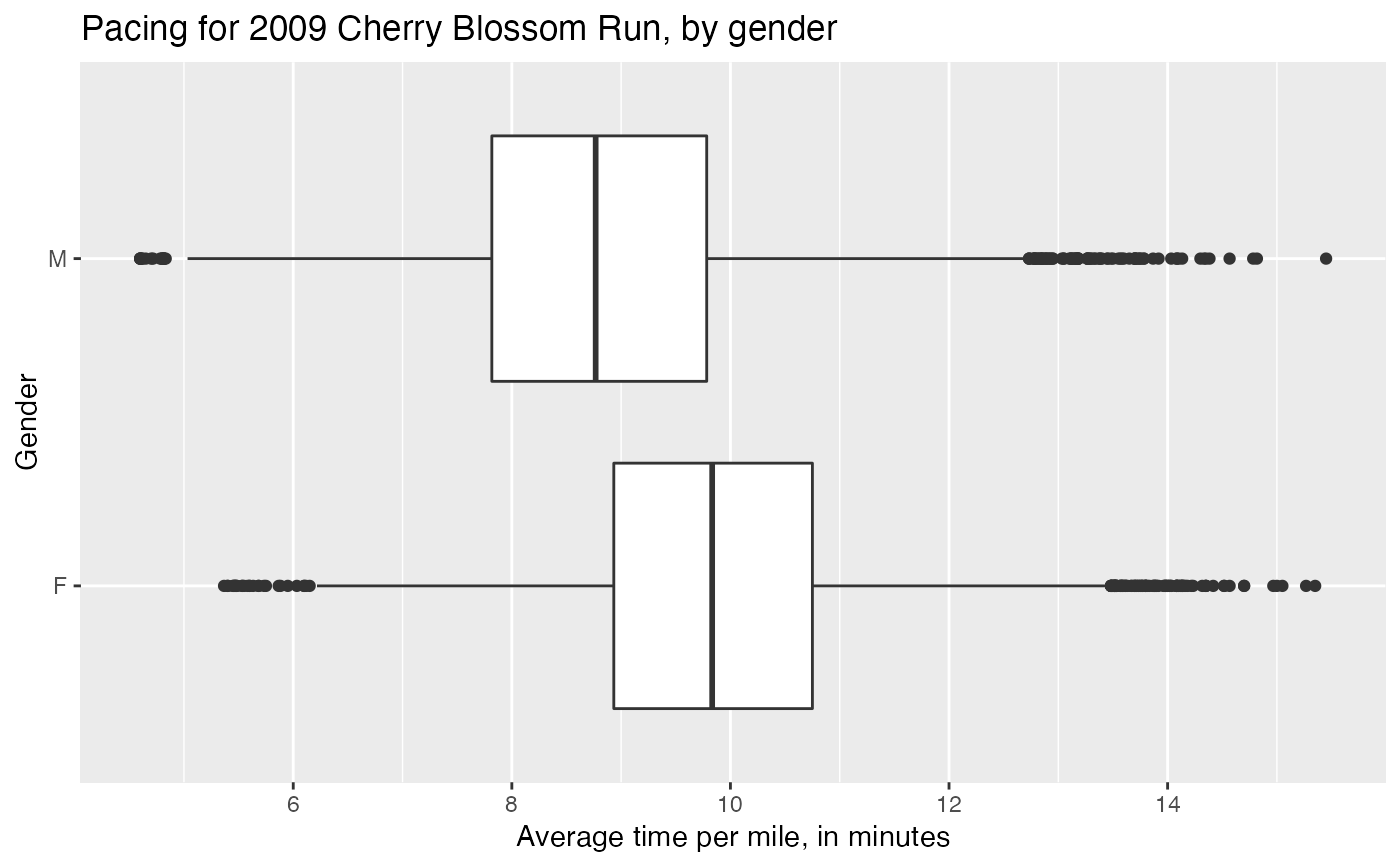
 # Pacing times by gender
ggplot(run09, aes(x = pace, y = gender)) +
geom_boxplot() +
labs(
title = "Pacing for 2009 Cherry Blossom Run, by gender",
x = "Average time per mile, in minutes",
y = "Gender"
)
# Pacing times by gender
ggplot(run09, aes(x = pace, y = gender)) +
geom_boxplot() +
labs(
title = "Pacing for 2009 Cherry Blossom Run, by gender",
x = "Average time per mile, in minutes",
y = "Gender"
)